(Updated 12th January 2021)
Floating debris from the crashed flight MH370 has been found and reported to the authorities in 22 locations throughout the Southern Indian Ocean (SIO). A total of 33 items drifted to these locations from the crash site, over a 3 year period. In a previous paper entitled “The Final Resting Place of MH370”, which I co-authored with Bobby Ulich, Victor Iannello and Andrew Banks, we analysed the MH370 flight path from Kuala Lumpur, Malaysia to a last estimated position of 34.2342°S 93.7875°E in the SIO, based on satellite, radar, weather, fuel and aircraft performance data. The purpose of this new paper is to determine the MH370 crash location using an analysis of the oceanic drift of these debris items, independently from any other data.
The MH370 crash location was 34.13°S ± 1.06° near the 7th Arc at a longitude around 93.98°E and the search area is defined as a circle with a radius of 65 nm centred on the crash location.
The updated paper can be downloaded here
@All
Here is the first result of the WSPR data analysis compared with the Inmarsat satellite BTO and BFO data in the SIO on 7th March 2014 between 19:20 UTC and 8th March 2014 00:20 UTC.
The world map link shows a WSPR detection by a receiving station 4X1RF at KM72LS in Haifa, Israel from a transmitting station VK3DXE at QF21NV in Melbourne, Australia on 7th March 2014 at 21:20 UTC with a SNR of -26 db and a drift of -2 Hz/minute (marked in red). There are several other forward and back scatter transmissions in the 14 MHz band at the same time.
https://www.dropbox.com/s/3wswv2o1z3tk8zv/WSPR%20Cells%2007032014%202120%20Tx%20VK3DXE%20at%20QF21NV%20Rx%204X1RF%20at%20KM72LS%20World%20Map.png?dl=0
The detection aligns with the UGIB flight path following a LNAV 180 track from 2.9350°N 93.7876°E at 19:41:03 UTC to 34.2342°S 93.7876°E at 00:19:29 UTC (marked in blue). This flight path assumes a Long Range Cruise (LRC) speed mode, which would position MH370 at 10.3423°S 93.7876°E at 21:20 UTC.
Zooming in on this WSPR detection the aircraft is detected 18 nm North of flight route T41 in the vicinity of waypoint BEBIM. Flight route T41 runs between YPCC Cocos Island Airport and waypoint RISMI to the West. There was no traffic on this part of flight route T41 at 21:20 UTC. The aircraft traffic to and from Oceania and the Middle East used either flight routes such as N509 or N640 much further North or flight route L894 much further South.
https://www.dropbox.com/s/i95ez4xhvpdavfm/WSPR%20Cells%2007032014%202120%20Tx%20VK3DXE%20at%20QF21NV%20Rx%204X1RF%20at%20KM72LS%20Flight%20Route%20T41%20Zoom%20Map%20.png?dl=0
Here are the details of the WSPR detection at 21:20 UTC.
https://www.dropbox.com/s/916cdnob1qdvqau/WSPR%20Cells%2007032014%202120%20Tx%20VK3DXE%20at%20QF21NV%20Rx%204X1RF%20at%20KM72LS.png?dl=0
Hi Richard: I’m still struggling to understand how WSPR reports can provide any new information. Re the 7th March 2014 at 21:20 UTC report, Your maps show that the GC path between the Tx and RCVR crosses the path you believe MH370 took. (BTW…I don’t disagree on your MH370 path. It had to be somewhere pretty close to that path and timing.) OK. So they cross. But what tells us the radio path was enabled by a reflection off of MH370? As I understand it, there could have been a refection off of any of the many aircraft in the IO at that time. And possibly over land too. Could have been a plane far north, south, east or west of where MH370 was at the time. I don’t see any way to connect this to MH370. What am I still missing?
@ALSM
@RobW and I independently concluded that the WSPR spot on 7th March 2014 at 21:20 UTC is a candidate MH370 WSPR spot by process of elimination.
As previously mentioned, the location of other aircraft in the proximity of MH370 is recorded in ADS-B data and can be estimated from flight plans. There were no other commercial aircraft in the vicinity of MH370 at this time. Of course military aircraft are not included in ADS-B data.
In the process we follow, which I explained in more detail in my comment on 1st March at 12:02, we also check whether there were any other WSPR spots between the TxRx link pair in the same timeframe on the previous 7 days or subsequently. There was one other spot between VK3DXE and 4X1RF at 21:08 UTC on the same day, but none in the previous days in the same timeframe or after 21:20 UTC on 7th March 2014.
Here is the Jeffreys Bay Debris Analysis: https://bit.ly/3c5Wj6Z
@ALSM
Mike, thanks to you and Don for the analysis.
Any thoughts on the piece of tape running nearly completely width-wise across the underside?
No. I’m not sure what that is.
Thanks Mike.
@ALSM
Many thanks for the link to your presentation!
@All
An excellent presentation made by Mike Exner and Don Thompson at the MH370 Next-Of-Kin Press Conference in Kuala Lumpur on the occasion of the 7th Anniversary of the loss of MH370.
@All
An HF radio transmission can be assumed to be isotropic, but that depends on the antenna configuration.
An HF radio reflection or scattering at an aircraft can be assumed to be isotropic, but can also be assumed to possibly change the direction, phase or wavelength of the original signal.
That is why, @RobW and I are only talking about MH370 candidate detections by WSPR TxRx links and not talking about confirmed detections, localisations and identifications.
We are doing our best to eliminate all other possibilities by using ADS-B data, flight plan estimates and WSPR detections in the same timeframe on other days, both prior and post detection, but ultimately we cannot be 100% sure that we have covered all eliminations.
However, the more detections we discover along a particular route, which are consistent with the satellite data and the aircraft performance, the more likely we are to be able to confirm the MH370 track using the WSPR network database.
Grace Nathan; Her recent view of the state of play, including the state of search offers and renewal of the Malaysian investigation team:
https://www.bfm.my/podcast/evening-edition/evening-edition/mh370-7-years-later
David- That was good interview with Grace Nathan.
I agree there is optimism that the current Malaysia PM will be more supportive re: MH370, hopefully some MH370 progress can be made before the next regime change.
@All
I just heard the sad news that Dennis Workman aka @DennisW passed away last weekend in a fatal motorcycle accident.
I wanted to pass that information on as he was active on this and other MH370 online forums. I for one will miss him as an outstanding analyst, incessant debater and a personal friend.
Peter Large said on breaking this unfortunate news “He has posted his last comment, so to speak”.
Our thoughts and prayers go out to his family at this difficult time. May he rest in peace.
RIP DennisW
@All
The last comment from Dennis on this web site was on Sunday 28th February 2021 at 07:04 am his time. After our usual argument to and fro, he simply said “@Richard, I sincerely wish you the best.”
He died just after 3.30pm that same afternoon.
I am devastated by the loss.
His good friend Pete Large said “I am sure he came across as cantankerous at times but he had an incisive mind and enjoyed a good debate on the facts, data and logical reasoning. I was also impressed by the fact that after his retirement from Silicon Valley he was an active volunteer with his local fire department as a first responder and EMS, and still riding his motorcycles at 76. Quite an individual!”
Very sad news regarding Dennis.
@Mike Eichhorn
I have run your new Matlab script with the thinning-out procedure. I have compared the results for both BRAN2015 and BRAN2020 data models as well as for both the Flaperon specific dataset and the generic dataset.
https://www.dropbox.com/s/h1i8sgzg9hd5oxv/Trial%20Uniformly%20Split%20Results%20BRAN%202015%20and%20BRAN%202020.png?dl=0
Your uniformly spread trials reduced the overall CISRO data set from 86,400 trials to 59,004 trials in each case. The percentage of trials arriving within the distance window of 20 km of the Flaperon debris found in Reunion remains the same, but the percentage of trials arriving within both the distance window of 20 km and the time window of 20 days reduces slightly with BRAN2020. Interestingly, the uniform distribution allows multiple modes of 34°S and 39°S for BRAN2015 for Flaperon trials and 36°S and 40°S for BRAN2020 with generic trials.
The percentage of trials arriving within the distance window of 20 km of the Outboard Flap find in Tanzania increases with the uniform distribution for both BRAN2015 and BRAN2020, but the percentage of trials arriving within both the distance window of 20 km and the time window of 20 days decreases with BRAN2020.
Overall there is a slight bias toward more northerly crash latitudes shown by the Flaperon results using the full CSIRO dataset of 86,400 trials, but this bias is more pronounced with the generic data set.
The Flaperon results throughout the various tests show a lower standard deviation and point to a crash latitude around 36°S, whereas the generic results have a much higher standard deviation and point to a crash latitude between 28°S and 33°S.
@Richard
Thank you for your new analysis. That is what I presumed, crash positions more northwards. If you mean multiple modes = multiple crash locations, I noticed the same effect in my simulations. With an increasing leeway coefficient, multiple hot spots (crash sites) are possible. How do you calculate the standard deviation for the multiple modes?
@Mike Eichhorn
The mode is the most commonly occurring crash latitude bin in the set of crash latitude bin results within a 20 km distance window and 20 day time window.
Sometimes there is more than one value that occurs equally often in the set of crash latitude bin results, e.g. 34°S and 39°S both occur 4 times each in the 17 values in the set of crash latitude bin results for BRAN2015 Uniformly Spread Flaperon Trials. So the mode can be either 34°S or 39°S.
The mean and standard deviation are calculated using the full set of crash latitude bin results in each case.
@Richard. WSPR. Despite your explanations I have not really grasped the significance of half-way points between Tx and Rx for HF. Web references to aircraft scatter mostly relate to VHF and UHF and how for hams it can increase the ranges of that. One of those sources notes, “Aircraft scatter, occurs where an aircraft is flying in the air along a signal path. The signal may not be available until the aircraft is at the midpoint, half way between your location and the transmitter, but it can occur at any point.” I take it in that case the line of sight range to aircraft plus then to Rx is maximised.
A Wikipedia article on aircraft scatter notes that, “Range and possible contact lengths are affected by the size of the plane, flight level and the approximate crossing time of the central part of the straight line between the two communicating stations.[4].” However chasing down that reference I found:
https://web.archive.org/web/20170914091357/http://home.swipnet.se/2ingandlin/ACS.htm
That again is about VHF/UHF, and microwave.
Here is a comprehensive, “Introduction to HF Radio Propagation” though that naturally does not cover aircraft scatter: https://www.sws.bom.gov.au/Educational/5/2/2#:~:text=The%20variations%20in%20density%20of,distant%20locations%20on%20the%20ground.
The WSPR references on the web are by hams and Taylor about how to spot anomalous range in the refracted frequencies, principally due to ionospheric conditions. I have found no mention of the above half distance in those except (and this at 2 metre wavelength), at 22:50 of:
https://www.youtube.com/watch?v=XcZEdJ_6QH8
By “cloud” I take it he means a temperature inversion (see 2.9 in the immediately above).
Is HF symmetrical refraction at half maximum one-skip distance the basis for that half range you have utilised? If so wouldn’t that assume that a reflection from an aircraft would not be in a fan?
Also I have located no reference to your use of a perpendicular bearing from that.
Would you point me to some explanation of those, the half way and the perpendicular, that I as a novitiate, might comprehend?
@Richard. Another opinion, by an ex Malaysia Airlines Flight Operations director
“For the record, during the early days, Captain Zaharie was my co-pilot…..I am especially disturbed by the allegations thrown at Zaharie, that he could be responsible for the aircraft going missing.”
https://www.nst.com.my/opinion/columnists/2021/03/673058/bar-new-evidence-lets-close-mh370-file
@David
Rather stupid for an innocent Captain Zaharie to run a simulation of a flight with a Boeing 777 to fuel exhaustion in the Southern Indian Ocean on his home flight simulator and then purely by accident it actually happens shortly afterwards in reality with MH370.
Of course, an ex Malaysia Airlines Flight Operations Director would prefer that the MH370 mystery would just go away and we should “forget the whole thing and move forward”. Unfortunately for him, the MH370 saga will not go away, until the mystery is solved.
@David
I am also a novice at WSPR, but with help from @RobW I am learning fast.
I agree that my worked example was an over simplification and misleading to imply that there is anything magic about a halfway point or the perpendicular to that point. It is much more complicated than that. Let me try again.
In the UGIB paper (which for new comers refers to the Flight Path Analysis paper written by Ulich Godfrey Iannello and Banks) the hypothesis was a flight path in the LNAV180 navigation mode to an ultimate waypoint at the geographic South Pole ending at fuel exhaustion at around 34.2°S 93.8°E near the 7th Arc.
The following link shows this MH370 flight path and the WSPR link between Tx HB9CZF at JN47CH near Zurich, Switzerland on 7th March 2014 between 22:46 UTC and 22:56 UTC and Rx VK6ZRY at OF78VD near Perth, Australia. The WSPR link appears to have picked up flight EK425. There is also another WSPR link between Tx VK7F1 at QE49 in Tasmania and RX VK6ZRY near Perth at 23:08 UTC. It appears to have picked up MH370, either from back scatter from the short path or forward scatter from the long path.
https://www.dropbox.com/s/943lmeyi8ziccwd/MH370%20and%20EK425%20Flight%20Path%20plus%20WSPR%20Rx%20at%20VK6ZRY.pdf?dl=0
I agree that the great circle path (short or long) is only a clue to an aircraft detection en-route and you do not know where along the path the detection took place, as the radio waves are bouncing of the ionosphere. @RobW has added a software called Proplab 3.1 to our toolkit, which allows us to perform ionospheric ray-tracing between locations at particular times. Here is a link to an example between Tx HS0ZKM at OK03GR in Bangkok, Thailand and the MH370 Last Estimated Position (LEP) and then on to Rx VK6ZRY in Perth in the following link. The ionospheric ray-tracing is run on 8th March 2014 at 00:20:30 UTC.
https://www.dropbox.com/s/wypbkfn8fv2k1v5/2021-03-09%2020_28_19-Proplab%20Ray%20Tracing%202021.03.08%2000_20%20h%20UTC%20HS0ZKM%20LEP%20IG.png?dl=0
https://www.dropbox.com/s/86zsiu2wiqbvbgr/2021-03-09%2014_51_21-Proplab3.1%20Ray%20Trace%20LEP%20IG%20to%20PER%202014.03.08%2000_20%20h%20UTC.png?dl=0
WSPR detection is relatively easy by searching for anomalies due to aircraft scatter and using a process of elimination by checking the same WSPR links in the same timeframe on other days before and after the candidate detection event. WSPR localisation is much more difficult and requires ionospheric ray-tracing of the original Tx and the aircraft reflected or scattered Tx.
@Richard. Thanks for the clarification, news of progress and highlighting the difficulty in localisation.
@All
Here are two WSPR anomalies during the MH370 flight path southwards into the Southern Indian Ocean. The transmitting station is VK3DXE at QF21NV in Melbourne, Australia. The two receiving stations are 4X1RF at KM72LS in Haifa, Israel on 7th March 2014 at 21:08 UTC using the short route with a SNR of -22 dB and a drift of -1 Hz/minute and VK6ZRY at OF78VD in Perth, Australia on 7th March 2014 at 22:38 UTC using the long route with a SNR of -9 dB and a drift of -1 Hz/minute. I previously reported another signal received at 4X1RF at 21:20 UTC with a drift of -2 Hz/minute, but the signal at 21:08 UTC is stronger.
Here is a world map showing the WSPR signal paths:
https://www.dropbox.com/s/v3zzdg2uizqqoui/WSPR%20Tx%20VK3DXE%20at%20QF21NV%20Rx%204X1RF%20at%20KM72LS%20and%20VK6ZRY%20at%20OF78VD.png?dl=0
Here is a close up of the MH370 flight path as hypothesised by UGIB. The WSPR candidate detections and their ionospheric propagation paths still need to be checked. Both WSPR candidate detections have been checked for the same TxRx links in the WSPR database on previous days in the same timeframe.
https://www.dropbox.com/s/7pkkjer0ouk0ep3/WSPR%20Tx%20VK3DXE%20at%20QF21NV%20Rx%204X1RF%20at%20KM72LS%20and%20VK6ZRY%20at%20OF78VD%20Zoom.png?dl=0
@Richard. My understanding is that those anomaly times indicate something interfered with those continuing HF transmissions’ strength and frequency then; and that the times were close to where MH370 would have been if on the UGIB track. Also, the short path is forward scatter and the long path, back?
You would expect if the aircraft was flying in the opposite direction that the drift on the long path would be +ve?
@Richard. Please replace my second question with:
“When would you expect the drift to be +ve?”
@David
On further analysis, the first candidate from Tx VK3DXE to Rx 4X1RF at 21:08 UTC using the short path is still looking good.
The second candidate from Tx VK3DXE to Rx VK6ZRY at 22:38 UTC using the long path is not looking good. The WSPR transmission is at 37 dBm (5.01 W) using the 20 m wavelength 14 MHz frequency band.
The short path (SP) propagation wheel for 20 m at 22:00 UTC and 23:00 UTC shows 100%, which explains why the received SNR was very strong at -9 dB.
https://www.dropbox.com/s/mprdcrsug51y5im/WSPR%20Tx%20VK3DXE%20Rx%20VK6ZRY%2020m%2014MHz%20Short%20Path%20Propagation%20Wheel.png?dl=0
The long path (LP) propagation wheel for 20 m at 22:00 UTC and 23:00 UTC shows 10%.
https://www.dropbox.com/s/rydv2bfqlmjg2m9/WSPR%20Tx%20VK3DXE%20Rx%20VK6ZRY%2020m%2014MHz%20Long%20Path%20Propagation%20Wheel.png?dl=0
@David,
Short Path vs Long Path
In my view, it is not clear yet if short and long path signals interfere on a great circle or close to a great circle in a constructive or destructive manner.
SNR
The strongest SNR does not necessarily mean, it will be our best signal. The integration gain of these WSPR signals lasting for 2 minutes is up to 30 dB. We are looking for anomalies in the SNR between the same TxRx Links in the same timeframe. If you have a series such as -20 dB, -18 dB, -12 dB, -9 dB, -13 dB within 1 hour, then you would classify -9 dB as an anomaly.
https://www.dropbox.com/s/l5839k3sxva4bp0/WSPR%20Cells%2007032014%202200%20to%200020%20Tx%20VK3DXE%20Rx%20VK6ZRY%20SNR%20Anomaly.png?dl=0
Drift
You ask: “Is there any significance in the direction of a drift anomaly, whether positive or negative?” In the two examples below, between the same TxRx Link in the same timeframe, the drift is positive, negative and zero. We are looking for anomalies in any direction.
https://www.dropbox.com/s/ywqamsq2m5z98me/WSPR%20Cells%2007032014%202200%20to%200020%20Tx%20N7SCQ%20Rx%20CX2ABP%20Drift%20Anomalies.png?dl=0
https://www.dropbox.com/s/v1aq2cp5wiuomqy/WSPR%20Cells%2007032014%202200%20to%200020%20Tx%20JH1GYE%20Rx%20CX2ABP%20Drift%20Anomalies.png?dl=0
@David
Forward Scatter
This is the usual case when a signal will be scattered forward by an aircraft in a more or less direct line between transmitter (Tx) and receiver (Rx), especially on long distance (DX) between continents.
Backscatter
In this case, a part of the signal will be scattered back to the transmitter/receiver as is the case with normal mono-static RADAR. For example, we have observed back scatter between VK7BO and VK7ZL on 28 MHz, where they do not copy each other under normal conditions.
@Richard. I appreciate your answers thank you and wish your joint campaign a fair wind.
@All
Between 18th March 2014 and 16th April 2014, AMSA conducted the aerial search for MH370 in the Southern Indian Ocean (SIO). A total of 345 flights departed from Perth Air Force Base to various parts of the search area from 18°S to 45°S. A total of 3,177 flying hours were conducted. We know for each day, which areas were searched. The flights left Perth in staggered time slots some departing before dawn and some returning after dusk. The goal was to maximise the day light hours in the search area.
I plan to create a database of WSPR links starting one week before the 7th March 2014 on the 28th February 2014 and running through to after the aerial search ended. I am interested to see what the normal pattern of WSPR links is, without either MH370 or search aircraft from the aerial search in the SIO. I want to see if any change in the normal pattern can be detected during the evening of 7th March 2014 and during the aerial search activity. Due to bad weather, there was no aerial search on 25th March 2014 and 1st April 2014.
I plan to focus on WSPR links that cross the SIO from the Middle East and Africa to Oceania, in either direction, to/from Israel to South Africa in the West, to/from Thailand to Australia in the East. Such WSPR links cover distances greater than 8,000 km and are reliant on the ionospheric conditions. MH370 flew over the SIO at night, whereas the majority of aerial search flights were conducted during the day. It will be interesting to see how many WSPR link anomalies are detected and if any pattern emerges.
@Richard
Please find my report about a possible crash site of MH370 in the folder:
https://www.dropbox.com/s/vsvnv09oefo5hbm/MH370_Report_Mike_Eichhorn.pdf?dl=0
Please feel free to publish the report on your website.
Mike Eichhorn: From sections 4.1 and 4.2, I conclude that the leeway assumption is so critical that without knowing the true value _for each piece of debris_, drift analysis can not provide useful results. Is that a fair interpretation?
@ALSM. This is a fair interpretation if the shape of debris items generates a high drag force exerted directly by winds. This requires a high drag coefficient and/or a high horizontal projected area on air. See Figure 2 in
https://www.environment.gov.au/system/files/pages/8ff786ed-42cf-4a50-866e-13a4d231422b/files/marine-debris-sources.pdf
It is also correct that we have to use for each piece of debris a characteristic leeway coefficient. My assumption that the wind effect (leeway coefficient near zero) is negligible results from the shape and the size of the debris items found. Only the debris found on Pemba Island (Item 19) looks out of water. See:
https://www.mot.gov.my/en/Laporan%20MH%20370/Summary%20of%20Debris%20Recovered%20-%20Updated%2030%20Dec%202018.pdf
To find the correct leeway coefficient for each piece of debris is difficult using a forward-in-time simulation and counts the particle near locations where items of debris were found. Three reasons. (1) Particles that have a more extended travel period before they washed up on land have higher location uncertainties. (2) Using higher leeway coefficients results automatically in more found particles on the beaches. (The Wind blows most time westwards). (compare Figure 29, 35, 41 in my paper.) (3) The start position does not correspond with the assumed crash position (start on 7th arc). One idea is to carry out sea trials for each of the debris, which CSIRO did for the flaperon.
@Mike Eichhorn. Your, “One idea is to carry out sea trials for each of the debris, which CSIRO did for the flaperon.”
In case you can use this, the CSIRO’s offshore trials included a replica “Roy” and flap fairing, your items 2 and 4. See your [18] Figs 2.3.4, 2.3.5. See also Fig 2.3.3.
You will notice in the 2 day offshore trial that in fact those two items trailed the ‘SVP’ (ie GDP) undrogued drifters, so in that trial were at less than the drifters’ estimated 1.2% leeway coefficient. In 2.3.5, the 7 days’ trial, there was divergence, the fairing then curiously rejoining the drifters but “Roy” not.
However what the ‘0.86h’, ‘1.6h’, ‘1.7h’ represent – e.g. if they are different times – is unclear to me.
I believe the fairing would have been concave downwards, the CSIRO reporting it being very skittish the other way up. The apparent skid/cartwheel downwind by ‘Roy’ might have applied to the real thing during the early part of its voyage, before it became heavily fouled with barnacles.
In the fairing’s case, as apparently a typical piece of MH370 flotsam, these offshore trials’ outcomes were complemented and preceded by those of bay and inshore trials. See [19] Fig 2.2.1, 8/9th August, 2016 trials, these being depicted at Fig 2.2.3.”[other days’ work]”.
I notice from all these trials that the outcomes are far from consistent or precise. Dr David Griffin has commented that as the items become separated they are subject to differing wind gusts and local eddies and in some cases, observation supplements data. He mentioned this being the case with the flaperon continuing at around the 10cm/sec in zero wind, the CSIRO’s index addition to the overall effect of wind. I imagine that is from residual wavelets hitting the exposed trailing edge and the momentum of the rebound.
On other matters, you make no mention of including that flaperon’s index addition of your Table 1’s, “10 cm/s in wind direction” (which, incidentally, you list under Stoke’s drift but I think might be wave action generally).
But also that and the flaperon’s drift rate of 1.2% of wind were not in the wind direction but either 10˚ or 20˚ to the left of that. The CSIRO modelled both, though used the latter. See [19] Fig 3.2. It is possible though that the drift direction might be to the right when the flaperon happens to be flipped as the wind drops beneath flipping speed. Flipped, its deep end is switched. Speed could be affected too. The CSIRO filmed the flaperon flipping but there appear to have been no winds at that speed in recorded trials.
The part outer right flap, your item 22, might drift off-downwind too, one end sinking lower, or even have two stable courses as the French computer fluid dynamics analysis indicated would be the way with the flaperon.
About your para 4.2, from the typical leeway coefficients’ range at the top of your page 2 I do not see that the 0% – 0.4% band applies to MH370 items at that late stage. Also, about your 4th dot point and your Fig 45’s inverted triangle, the Kudahuvadhoo Island, Maldives, aircraft was not MH370. See this post by Don Thompson:
https://mh370.radiantphysics.com/2020/03/09/new-report-released-for-mh370-search/#comment-28913
Also see his 22nd Sep, 2020 posts of 2:26 pm and 23rd at 6:58 pm
At [19] Fig 4.1 is the result of CSIRO modelling at a leeway coefficient of 3%, representing high windage items. That and the above two flaperon drift angles modelled can be seen as a form of sensitivity analysis?
By the way that 3% modelling also was included as part of the comparison of modelled drift areas with the actual surface searches. Such items as seat cushions and lifejackets might have been afloat then, still. See [21] Fig 4.1.
@David
You stated: “However what the ‘0.86h’, ‘1.6h’, ‘1.7h’ represent – e.g. if they are different times – is unclear to me.”
In CSIRO i [18] Figure 2.3.5, I assumed the annotations at the end of each track such as 0.86h etc. are the interval between the GPS measurements of position along the track.
In CSIRO i [18] Figure 2.3.5, I assumed the annotations in the middle of each track such as 3.9d etc. are the interval between GPS measurement at that position and the start time.
@Richard. Dr David Griffin has explained that these are the time intervals before the end of the data-window, 25 Oct 07:23. He has added that the instruments do not give position synchronously. There are positions within a few hours (“h”) of the end time and several earlier that are in days (“d”).
I see from Fig 2.3.5 that the times for the last positions of the two replica flaperons are 0.4 hrs apart but that does not of itself explain the distance between them of over 7 miles. To me, supposing that the two were near-identical, that is an example of the randoms that pervade this type of experiment.
Turbulence was described by a science journalist in COSMOS, an Australian magazine, as, “…the last great problem of classical physics”. The article notes that, “…..vortices can emerge on the quantum scale”. It expands on that if you have a general interest and a few minutes.
The opening sentence appeals to me, ““When I meet God,” physicist Werner Heisenberg allegedly once said, “I’m going to ask him two questions: why relativity? And why turbulence? I really believe he’ll have an answer for the first.”
https://cosmosmagazine.com/science/physics/turbulence-trouble/?utm_source=Cosmos+-+Master+Mailing+List&utm_campaign=bf51f115b4-EMAIL_CAMPAIGN_4_FEB_2021&utm_medium=email&utm_term=0_3f5c04479a-bf51f115b4-180299421&mc_cid=bf51f115b4&mc_eid=e65f361e70
Back on topic, the “Roy” last position at 0.86 hours that I assumed might be earlier than the others more to the NNE is in fact about 0.8 hrs later, confirming that that was way outside any supposed 1.2% drift coefficient.
@David
Many thanks for the clarification. Even if we knew the windage of each MH370 floating debris item precisely, the nature of the turbulent ocean would still not allow us to predict with certainty, where each item would finally beach. However, we should be able to set certain boundary conditions in both the spatial and temporal domains.
Great article on turbulence from Cosmos.
An awesome but likely fictional quote from Heisenberg. It reminds me of another quote. “I saw everything God does, and I realized no one can really understand what happens. We may be very wise, but no matter how much we try or how much we claim to know, we cannot understand it all.” Ecclesiastes 8:17 Contemporary English Version.
If 370 had crashed at the Equator and 70°E, debris would have arrived much earlier in MozambIque, Madagascar, Mauritius, and South Africa, and in La Reunion either earlier or maybe not at all. There would also be debris in the Maldives, Somalia, Sumatra, and Sri Lanka.
@BG370
The missing debris on highly likely areas where debris should be beached is a good point. I wrote this as an argument against the Maldives in my report. According to the forward-in-time simulations, debris should be found on the coasts of Somalia and Kenia, in Sumatra, in case of a leeway coefficient of 0 % or higher than 0.4% (see Source 1 in Figure 22, 34, 40 in my report), not for a leeway coefficient of 0.4% (see Source 1 in Figure 28.). For the correct evaluation of my following answer describing this behavior: I‘m not an Oceanographer. I think this is a timing problem in Sumatra. The ocean current near the Sunda Strait is strong and can change its direction from most time westwards to eastwards (e.g. December). Debris can be beached if they are near the coast and an eastwards ocean current flows to the Sunda Strait. I created a video (SundaStrait.mp4) where you can see the ocean current conditions around the Sunda Strait in detail. The vicinity of the Maldives is not a hot spot of beached debris in my simulations. A reason is maybe the Equatorial Current, which flows on the crash day 08-03-2014 with 0.9 m/s westwards away from the Maldives (see Maldives.pdf). Sri Lanka also is not a hot spot in my simulations using CMEMS models. Maybe particle simulations find a hot spot for beached debris on Sri Lanka’s coasts using other ocean current models.
In terms of the date beached of item debris, the forward-in-time simulations show for many debris locations particles with earlier arrival times. One argument is the complex behavior of the beaching process. I wrote this in my conclusions.
Another argument was discussed on the 7th Annual MH370 Remembrance Event 2021. See:
https://fb.watch/4koeXsyi8H/
Mr. Jiang Hui asks (position in video: 01:09:00) about the reason why an item of debris needs 7 years before it’s beached in South Africa. Professor Chari Pattaratchi (position in video: 01:12:12)sees a reason in the complex weather conditions, “… they can refloat and go again“. I think this reason is also valid 6 years earlier to describe the missing of debris beached earlier.
That debris can easily beach on Le Reunion or Mauritius does not seem entirely natural to me, if I see the ocean current conditions around the islands (see Islands.mp4).
The phenomena of missing early beached debris also exist for start positions along the 7th arc. See
Figure 24 Source 1 (Maldives) debris item 1: 9 particles beached before time window, 7 particles beached within time window.
Figure 43 Source 5 (7th arc) debris item 1: 3 particles beached before time window, 3 particles beached within time window.
You can find the videos and the picture here:
https://www.dropbox.com/sh/3ohg2rz2xfr4532/AACIRz5H8br5FhF-FRe8Sq-ha?dl=0
@ALSM, @Mike Eichhorn, @David, @BG370,
The 32 MH370 floating debris items in Mike Eichhorn’s Table 2 all have a very low density and would have a high horizontally projected area on air of around 90%. As @David points out, the weight would increase with any biofouling or water logging, thereby decreasing the horizontally projected area on air.
25 of these items are flat panels with a height of 25 mm, with 22.5 mm above the surface of the water. This only happens in a flat sea, which is never the case in the Southern Indian Ocean (SIO).
7 of these items are structures with a height up to 304 mm (please see linked table). These items most likely did not float flat on the water, but presented large horizontally projected areas on air. As @David reminds us, some us these items may have flipped over frequently, changing both the windage, additional leeway and drift angle to the wind.
https://www.dropbox.com/s/hm5gialqajt8og8/Debris%20Items%20with%20Profile.png?dl=0
I think it is safe to conclude that the leeway coefficient was well above zero. This would contra-indicate the Maldives, in addition to the problem that @BG370 points out of arriving too early or not arriving at all in some locations or arriving in yet other locations where no debris has been reported.
I think it is safe to conclude that the leeway coefficient varied significantly for different debris items. The value of 1.2% from David Griffin plus an additional leeway of 10 cm/s plus the drift angle 20° left of wind may be a good estimate for the Flaperon. The value of 1.2% can only be a general indication for other debris items.
I think it is safe to conclude that the leeway coefficient varied for each debris item during the path across the SIO. As barnacles, microorganisms, plants, algae accumulated or water logging increased, the weight may have increased significantly. The weight of the barnacles found on the Flaperon is estimated at 0.6 kg.
Agree with BG.
Whereas the conspiracy theorists and authors are still actively suggesting the Maldives, it would be good to not give them further undeserved ammo, unless we really think it is supported by the drift data.
@TBill
I agree with you and @BG370.
The Maldives can be excluded from the next MH370 search.
All above:
I suspect we might all be in substantial agreement that:
1. Leeway is a critical variable; A difference of 0 to 1.2% can change the estimated POI by an amount greater than the estimated uncertainty in the 7th arc length that needs to be searched.
2. Each piece of debris will have a different, non-zero leeway (and angle?).
3. 1.2%/20° is probably the best estimate we can use for the flaperon.
4. Articles that are more 3D shaped (flaperon, R outboard flap segment, flap fairing…) will generally have a higher leeway coefficient; flat, not so much.
5. The ocean is rarely flat and calm; at times, some articles are frequently flipped and occasionally made airborne briefly, depending on shape and density. The “effective average leeway” for such articles could be higher than the flaperon.
@Mike Eichhorn
It is perfectly possible that some items beached, refloated and beached again. We have the example of “Roy” that was found twice on the same beach only several hundred metres apart in location, but 3 months later in time.
It is also perfectly possible that some items, when they refloated, transited further along the coast and beached in another location. The find in South Africa in August 2020 may be such an example.
The rebeaching phenomena is a possibility for some MH370 floating debris items, but is not a rule that will happen to all 32 items in your list. It would not be correct to conclude that all (or the vast majority) of 32 items were delayed in being reported because they refloated, one or more times, before they were found and reported.
From a crash location west of the Maldives and using a Leeway Coefficient of 1.2%, your figures show that 89% arrive early, 4% in the time window and 7% arrive late. The early and late percentages do not balance in the case of the Maldives.
By comparison, from a crash location at 34°S on the 7th Arc and using a Leeway Coefficient of 1.2%, your figures show that 46% arrive early, 14% in the time window and 40% arrive late. The early and late percentages balance out in the case of the 7th Arc.
Similarly by comparison, from a crash location at 36°S on the 7th Arc and using a Leeway Coefficient of 1.2%, your figures show that 39% arrive early, 17% in the time window and 44% arrive late. Again the early and late percentages balance out.
A crash location west of the Maldives can be discounted as it is unreasonable to expect that 89% for a Leeway Coefficient of 1.2% (or 75% for a Leeway Coefficient of 0%) would arrive early and refloat to be reported at a later time. A crash location west of the Maldives can also be discounted as only 4% for a Leeway Coefficient of 1.2% (or 5% for a Leeway Coefficient of 0%) arrive within the time window compared with 14% for 34°S and 17% for 36°S on the 7th Arc.
@All
I am nearing completion of my WSPR database of DX spots (> 8,000 km) between 28 Feb and 30 April 2014 across the Southern Indian Ocean in either direction.
There were 345 AMSA flights into the search area from Perth AFB during this time frame.
26 of these flights dropped SLDMB buoys in the search area and I have the precise date time and GPS location data for each drop.
I am now cross checking WSPR links with aircraft positions with anomalies in the WSPR links in either the received Signal to Noise Ratio and/or Signal Drift data.
@All
Between 28th February 2014 and 30th April 2014 there were 14.6M WSPR links documented globally. Out of these, there were over 16,000 daily WSPR links with propagation distances over 8,000 km, known as DX transmissions. On average there were 36 WSPR DX links across the Southern Indian Ocean (SIO) each day directly from coast to coast. There are more WSPR DX links that crossed the SIO from Tx and Rx points at greater distances from the SIO.
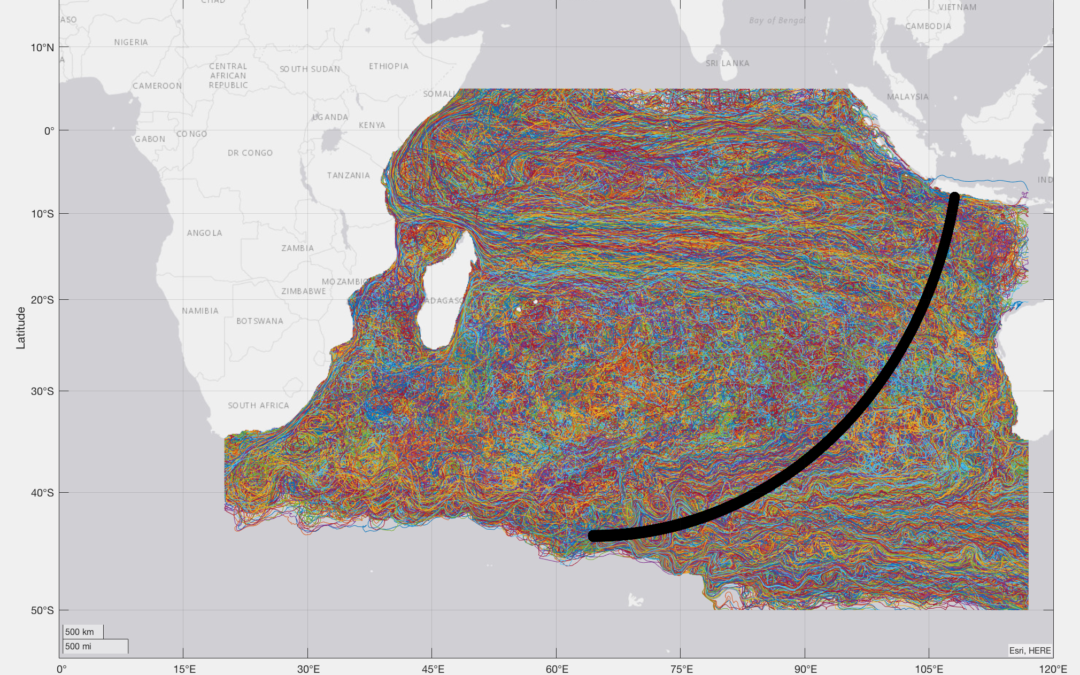
Here is a link to a map of the main Tx Rx WSPR DX links in the SIO during this timeframe. The East-West links are marked in red, West-East links are marked in green and bi-directional links are marked in blue. I have also marked the initial positions of the 26 Self Locating Datum Marker Buoys (SLDMBs) which were dropped by aircraft during the aerial search, between 18th March 2014 and 16th April 2014.
https://www.dropbox.com/s/z4d2b4vgj7n7ona/SIO%20WSPR%20DX%20Links%20and%20AMSA%20SLDMBs.png?dl=0
A number of the 345 flights during the aerial search have been detected using the WSPR data. I am working through a large dataset to establish any patterns in the data, that can provide insight into the flight path of MH370 on 7th March 2014.
@Richard
Richard, regarding the SLDMBs, do you have date and drop location data for those that you can share?
@David
When I reflect on your recent insights concerning turbulence and windage, it is quite remarkable that 12 MH370 floating debris items were found within 10 nm of each other on Riake Beach and Antsiraka Beach in Northern Madagascar.
On one hand, we have finds as far apart as Tanzania to South Africa, on the other hand we have a cluster of 12 finds within 10 nm after transiting over 3,000 nm from the 7th Arc.
@Richard. Yes, watching CSIRO animations the concentration of items headed to the northern end of Madagascar then locally wheeling up to and around its tip was high, seemingly sucked around it, most heading south. That could be a part of it. Another could be how easy it is for items to beach and stay beached there vis-a-vis nearby parts of the coast?
I have photos of the high density of general flotsam on the beach of an uninhabited small island not far to the north.
@BG370 may like to comment.
@David
If you are sailing across the Indian Ocean from East to West, there are a number of islands you could visit on your way. Eventually you will probably end up sailing to Madagascar and going around the northern tip to the sheltered anchorages on the north western side of Madagascar. As you approach Madagascar with a fair wind you might be doing 6 knots. As you round the northern tip of Madagascar you pick up the extremely strong current running at 9 knots and your boat speed picks up to 15 knots and you enjoy the ride of your life.
@Mick Gilbert
The SLDMB’s launch date times and positions are given in the following table:
https://www.dropbox.com/s/atr7y981cvuil1n/SLDMB%20Launch.png?dl=0
The SLDMB’s launch and track data is given in the following Excel link:
https://www.dropbox.com/s/g15tlkmavfqzvne/SLDMB%20Launch%20and%20Track.xlsx?dl=0
The AMSA Aerial Search Report is given in the following .pdf link:
https://www.dropbox.com/s/6nhfy2e1ouj6ymh/AMSA%20Aerial%20Search%20Report.pdf?dl=0
The AMSA Search Areas are shown in the following Google Earth .kmz link:
https://www.dropbox.com/s/gpt8yps343hdw5w/AMSA%20Surface%20Search%20MH370%202014.kmz?dl=0
I have favourably compared the SLDMB’s track data with my application software simulation based on NOAA drifter’s data.
@Richard
Outstanding! Thank you for that.
Yes there were many pieces of 370 debris from two beaches on different islands just a little over 10 miles apart. Not to mention the numerous possible personal effects recovered from those same beaches at the same time that were never addressed in any official report. I am interested in knowing the name of the island where @David saw photos of large amounts of flotsam. There could still be debris in other parts of Northern Madagascar buried in sand, or collected by locals, unrecognized, and used for other purposes.
@BG370. Farquar Island.
https://www.dropbox.com/s/9tmm4v297v9092z/Michael%20Price%2C%20rubbish%20Farquar%20Island.jpg?dl=0
@BG370. The photo was taken in Feb 2016. My friends that took it said the rubbish there extended for 1 – 1½ km.
Farquar Atoll it is I think, one of the Farquar Islands. They landed from a cruise ship.
In July 2017 I see an item beached there was brought to the attention of the Seychelles Civil Aviation Director.
https://translate.google.com/translate?sl=auto&tl=en&js=y&prev=_t&hl=en&ie=UTF-8&u=http%3A%2F%2Fwww.seychellesnewsagency.com%2Farticles%2F7563%2FDes%2Bdbris%2Bdavion%2Bdcouverts%2Bsur%2Blatoll%2Bde%2BFarquhar%2Baux%2BSeychelles&edit-text
Yes I agree that Farquahr is a good place. When I went to the Seychelles in 2016 I could not get there, but I told the media and officials that it would be a good place to look. I remember that debris found there later. I think the consensus was that it came from a rocket, and definitely not from a plane.
@Richard. Your ‘Debris Observed Reports Overview’ indicates that your item 32 (Malaysian item 27), ‘Right Wing No. 7 Flap Support Fairing’ had no barnacles at recovery. Indeed the Malaysian report on that depicts a ‘clean’ item and makes no mention of evidence of any.
http://mh370.mot.gov.my/Appendix1.12W-Item27No.7FlapSupportFairing.pdf
However I have just come across the photos below in which they are very evident.
https://www.avcom.co.za/phpBB3/viewtopic.php?t=185829
Hence this item can join those in which there can be confidence of beaching very shortly before recovery.
Two points: first, this item, just arrived, had done so late in the day, the second barnacled item to arrive in South Africa, but more than a year after the first. I notice the difference in shapes, which might have something to do with it.
Second, because there are no barnacles apparent in reports does not mean that there were not any at recovery. The Malaysians presumably were not alert. Clearly they could have identified the ‘unknown’ recoverer and contacted him.
@David
Many thanks for the additional information and the pictures taken on the morning that the Right Wing No. 7 Flap Support Fairing was found, showing it full of barnacles.
I will re-run the drift analysis for the location 32.097481°S 29.062852°E and for an arrival early morning on Friday 27th January 2017.
It makes you wonder, what other MH370 floating debris items were also full of barnacles on arrival, but had lost the barnacles by the time the first picture was taken of the item, which ended up in an official report.
@Richard. Correction. In the above I said, “The Malaysians presumably were not alert. Clearly they could have identified the ‘unknown’ recoverer and contacted him.”
Scrolling down now to the bottom of the comments under the photographs of the second URL I see that they were aware of the photos and his identity. They just didn’t mention the barnacles in their report.
@David
Well spotted!
Interesting to see the public exchange between Aslam Khan of AAIB Malaysia and Steve Onions in South Africa regarding this particular debris item. What else does Malaysia know that they failed to include in their report?
@David @Richard
Many private citizens who find debris choose to remain anonymous. Given what has happened to me, I can most certainly understand why.
Hello…not sure what happened to you…but I do enjoy privacy. I found an unconfirmed piece of honeycomb debris on a beach years ago and officials were quick to collect it…i can email the details if interested. Pls disclose email address
@Alex Thanks
Richard will send you my email and skype and facebook. Please send me photos and details. I’ll answer by Skype or facebook so those are better.
@David
I have re-run the drift analysis for the location at Mpame Beach, South Africa (32.097481°S 29.062852°E) and for an arrival of floating debris on or just before 27th January 2017.
Interestingly, there are no trials, using the BRAN2015 model data, that beach within 10 km of the location of the find of the MH370 Right Wing No. 7 Flap Support Fairing, although 214 trials pass along the coast within 30 km. Of these 214 trials that pass along the coast, they all pass much earlier. The last trial to pass near to Mpame Beach was 58 days before the 27th January 2017, which does not fit the fact that the confirmed MH370 floating debris item was full of barnacles. A note of caution: David Griffin’s simulation runs for 1030 days and the MH370 Right Wing No. 7 Flap Support Fairing was found after 1056 days.
I get a better result using the BRAN2020 model data. Although only 74 trials pass along the coast within 30 km, one trial (#27014) actually beaches at Mpame 34 days before the 27th January 2017. This trial originated from 37.1498°S 89.7806°E slightly East of the 7th Arc. The next closest trials within both the distance and time window originated from 34.5600°S 93.3597°E (#23923) and 30.8396°S 97.5985°E (#63111), which are both close to 7th Arc, one slightly to the East, the other slightly to the West.
This result confirms once again, that the drift analysis is not precise on distinguishing a particular crash latitude in the vicinity of the 7th Arc, but a recommendation for a search area between 30°S and 37°S would appear reasonable. The analysis of the latest debris item found in South Africa by Mike Exner and Don Thompson would additionally appear to confirm a crash location close to the 7th Arc, as it is possible that multiple flight control surfaces along the right wing were either damaged or even had detached from the aircraft, prior to impact making a long glide impossible.
To give you an idea of the trajectory of the MH370 Right Wing No. 7 Flap Support Fairing, here is a link to a map of the Southern Indian Ocean:
https://www.dropbox.com/s/9bncbel6dok4fsu/MH370%20Drift%20Analysis%20-%20C32%20Fairing%20-%20Trial%2027014%20-%20Trajectory.png?dl=0
The debris item may have been caught up in numerous gyres, especially in the last 300 days of the trajectory near Madagascar and crossing the Mozambique Channel, just as trial #27014 from the BRAN2020 model:
https://www.dropbox.com/s/2yaur865uto6um7/MH370%20Drift%20Analysis%20-%20C32%20Fairing%20-%20Trial%2027014%20-%20Zoom.png?dl=0
@Richard. Thanks for that. Given the total traverse time I didn’t expect a south-of-Madagascar track for the almost-on-time hit but it illustrates the vagaries of wind and current. I note the dependence too on model.
As to right wing separations there are the two recoveries from the one flap fairing to include; this and your item 5, ‘No.7 Flap Fairing 676EB’. That was recovered from Mozambique, sort of on your track, a year earlier. I do not know what would account for their damage though it looks more like impact than either shock or flutter.
You say, “…..it is possible that multiple flight control surfaces along the right wing were either damaged or even had detached from the aircraft, prior to impact making a long glide impossible.”
What I have contemplated is that if right wing parts, with or without those from that fairing, had separated before impact their somewhat different drift start locales to those of the impact debris might be detectable, broadly, in flotsam recovery places and timing.
However whenever those No 7 fairing parts separated, the bottom line is that the time separation of their recoveries, the second being recovered after being at sea 60% longer than the first (plus any delay in discovery of its beaching of the first), the random would appear to prevail. That is, with the current down the African coast I do not expect that it could take a year to travel from Mozambique to South Africa – though from the timings in that track of yours you maybe able to reinforce that. I imagine that the Mozambique part more likely rounded Madagascar’s northern end.
The associated outer flap part was recovered half way between the other two’s timings having hared off north to Tanzania, presumable having passed Madagascar’s northern end. That might suggest that it tracked well to the starboard of downwind, which would not be unexpected.
All in all though, chaotic.
All the same, I go through the above in case you can draw something else from it.
The case for the simulator premeditated pilot mass murder suicide would be a lot stronger if the captain had actually practiced the flight from KL to Igari, then practiced executing the 270 degree turn, then practiced the flight back over the Malay peninsula skirting the Thai Malay border, then practiced the second turn northwest at Penang . But he didn’t. So this simulator theory hangs it hat on a few manual moves in the Southern Indian Ocean with a mouse and saved files. Incriminating if he did it, but not ironclad, and a weaker case. One would think that a diabolical homicidal suicidal captain would actually fly a practice run on his simulator of the monumental last flight of his life, especially the early part in the Gulf of Thailand where he disappears and makes his great escape. But he didnt.
@Miden Agan
Welcome to the blog.
You raise an important question as to why there is a difference between Zaharie Shah’s home flight simulator and the actual MH370 flight path. I would like to make two points:
1. A number of analysts have previously pointed out that the timing of the simulation on 2nd February 2014, the fuel level used in the simulation and initial flight route in the simulation all point to the hypothesis that the original target was MH150 from Kuala Lumpur to Jeddah on 4th February 2014. The extra crew member as a 3rd pilot in the cockpit for MH150 makes this option more complicated than MH370 where there are only two pilots in the cockpit.
2. Zaharie Shah was completely familiar with the flight routes, air traffic, cruise flight levels, radar stations, FIR boundaries and fuel requirements over the Gulf of Thailand, Malaysia and the Malacca Strait. He had no need once the plan changed to MH370 to “practice run” the early part of the flight.
@Richard
Thank you for the explanation and welcoming me to your blog. Your comment is far more receptive and productive than the unwelcoming personal insult directed at me by ” Ikr.”
@Miden Agan
I understand that you felt insulted by the comment from @lkr.
It was @lkr’s first comment on my blog and I found it inappropriate in criticising another commenter and contributing nothing to the search for MH370.
I decided to let the comment pass without a warning, but in future I will not accept it.
@Miden Agan, @Richard:
Another reason why ZS may have decided not to carry out his plan with MH150 is that it was a day flight. Even if he could come up with an excuse to get both of his copilots out of the cockpit at the same time, he may have been worried that the plane or its contrails could’ve been seen by passing ships after diversion.
I don’t understand why ZS made the simulation in the first place. He was familiar with the flight routes, so there seems to be no point. It wasn’t even a full dry run since ZS seems to have dragged the aircraft along the route with the mouse instead of actually flying it and manually adjusted the fuel levels, either by directly changing them or by simulated fuel dumping.
One thing to consider about the simulator route is its end point (45S). @TBill noticed earlier that it is located exactly at the crossing between the LNAV path to YZPG and CMT 180, both starting from the simulated FMT at 10N. I have no idea why ZS chose this particular location as the end point for his simulation, but it seems unlikely to be just a coicidence.
miden: pretty lazy to post this verbatim [and here, non sequiter] from your contribution to Victor’s blog.
@Arto L
Welcome to the blog.
You raise the valid concern that MH150 was a daylight flight and any contrails would be seen by passing ships.
@TBill has previously raised the fact that MH150 was a mid week flight and ZS knew that the radar on the tip of Sumatra would not be operational at the weekend. I agree we should be careful making assumptions about what the pilot did or did not know. Airline pilots are not generally aware of the specific location of radar sites along the routes they fly, particularly military sites. The pilot might not have known about the Sabang radar, let alone its operating hours. However we do know that Zaharie Shah may have been well informed of regional military and radar defence capabilities, a sibling is a member of staff at the National Defence University of Malaysia.
Please see my comment dated 16th January 2021 at 12:32 to @Andrew
https://www.mh370search.com/2021/01/21/mh370-debris-drift-analysis/comment-page-1/#comment-119
Please see @TBill’s paper at https://www.mh370search.com/2021/02/04/guest-paper-by-bill-tracy/
Please see my comment to @TBill on 6th February 2021 at 12:41 https://www.mh370search.com/2021/02/04/guest-paper-by-bill-tracy/comment-page-1/#comment-211 where I state “You raise the key question as to why Zaharie Shah changed his mind between the simulator run on the 2nd February 2014 and the flight of MH370 on 7th/8th March 2014. We have discussed the 3rd pilot in the cockpit on the Jeddah flight, you point out the preference for a weekend flight where certain radar was not operational, you mention the choice of a night flight. Did these factors only come to mind for Zaharie Shah between 2nd February 2014 and the flight to Jeddah on 4th February 2014?”
You raise the key question as to why ZS ran the simulation in the first place?
In the same comment I stated to @TBill “Despite the insights you give to the fuel load, additional fuel loaded and fuel jettisoning, you make the excellent point that the final fuel load was exactly the fuel required to reach the magnetic South Pole, which on 8th March 2014 was at 64.304°S 136.709°E.” It could be that ZS simply wanted to see what fuel load would be required to reach the Magnetic South Pole and he later changed his mind to head for the Geographic South Pole and only went as far as the available fuel for MH370 would take him. The simulator position at 45.0852°S 104.1455°E is as far as the MH150 fuel load would take him if he made a final major turn southwards at waypoint DOTEN (now renamed AMVUR) at 10.742778°N 89.997222°E.
@Richard:
I find it strange that a military radar would be routinely switched off for the weekend. However, somehow ZS must have known that Sabang radar was inoperative on March 7th 2014. The location of FMT in the simulator route seems to be carefully planned so that the plane would remain out of range of Sabang radar on the way south. The LNAV route towards NZPG goes just outside its instrumented range almost to the nm. MH370 on the other hand must have passed within the range of Sabang radar to reach arcs 2 and 3 at the observed time. Any idea how ZS would have gotten this information? It is possible that ZS simply took a non-threatening trajectory when within Jakarta FIR and trusted that he wouldn’t be intercepted, but why would he take the risk instead of continue flying low and slow west or southwest away from Sabang until he was outside radar range?
You mentioned: “The simulator position at 45.0852°S 104.1455°E is as far as the MH150 fuel load would take him if he made a final major turn southwards at waypoint DOTEN.”
I recall that @Victor attempted to replicate the simulator flight himself and found out that he could go about 500nm beyond 45S without adjusting the fuel load after take-off. Anyway, it seems an unlikely coincidence that the point of fuel exhaustion and the crossing of the paths to NZPG and magnetic south pole are almost the same.
@Richard @ Arto L
Thanks for the comments and discussion.
The simulator evidence is potentially incriminating, but I respectfully remain unconvinced of its significance. It was not a flight flown, but rather a mouse moved. The captain did not practice the most critical early part of tge MH 370 route ..the theft, disappearance, and getaway. The insufficiency of the simulator evidence is highlighted by speculation that the captain may have been planning to divert a different earlier flight. If the existing simulator evidence applied to 370 were as ironclad as many claim, there would be no need for such speculation.
I would not base a future 370 search recommendation on speculation as to what bearing the captain may have plugged in based on what he may have been planning on his simulator to do to different flight. I would rely on the drift analysis and radar and satellite data, which is far more compelling.
@Miden Agan
I agree with you, that we should not “base a future 370 search recommendation on speculation as to what bearing the captain may have plugged in based on what he may have been planning on his simulator”.
You state correctly that we should “rely on the drift analysis and radar and satellite data, which is far more compelling”.
I would add that WSPR may add another dimension or insight to the drift analysis, radar and satellite data.
The MH370 community has mostly focused on the satellite data between 19:41 UTC and 00:19 UTC. I am now trying to determine the FMT path, where there is a large gap in the satellite data between 18:40:56 UTC and 19:41:03 UTC.
There are 28,414 WSPR spots between 18:22 UTC and 20:42 UTC. Many WSPR links cross the area around the Malacca Strait, Andaman Sea and the adjoining Northern Indian Ocean. Some of these WSPR links show anomalies and some are stable links with a good received signal (good SNR and no drift). I also have a copy of the complete regional ADS-B database, so I know where all the other aircraft at the time are to be found. It is a lot of data, but I am hopeful the data will produce a useful result.
@Arto L
Indonesian Military Radar Weekend Shutdown
If you find it strange that the Indonesian Military Radar was switched off at the weekend, then please read this report on the Indonesian Military Radar. It is written in Indonesian, but Google Translate does a good job.
https://www.dropbox.com/s/l0f68yscyvdg6xw/Indonesian%20Military%20Radar%20OPTIMALISASI-GELAR-HANUD.pdf?dl=0
I assume ZS got the Sabang radar information from his sibling at the National Defence University of Malaysia.
Fuel Requirement to 45S
@TBill observes that the fuel at 10N was 62,700 kg and that fuel was added during the simulation. In his paper he states: “Recently I discovered, quite by accident, that a 180S Magnetic flight from 1090E, runs out of the fuel loaded (62,700-kg at 10N) at or near the Magnetic South Pole. Although this is strong evidence of a 180S flight path, fuel modelling is needed to verify (below).”
Victor Iannello and Yves Guillaume in their analysis of the ZS Simulator dated 29th November 2016 state. “For the segment between 10N and 45S1, the fuel efficiency for the recovered data was 18.5 kg/nm, while that for the recreated flight was 13.8 kg/nm. This suggests that fuel was removed by the user during this segment, reducing the range and leading to fuel exhaustion at 45S1.” In Table 3 they show 62,700 kg of fuel at 10N.
10N is actually 10.1831°N 90.2245°E. DOTEN (renamed AMVUR) is 10.7428°N 89.9972°E and @TBill also uses 10N90E.
Waypoint DOTEN is 9,196.8 km (4,965.9 nm) from the Magnetic South Pole. 4,965.9 nm / 62.7 tonne = 79.2 nm/tonne. This broadly aligns with the figure of 80.2 nm/tonne from @TBill and the figure of 73.8 nm/tonne from Iannello/Guillaume.
@TBill and I are agreed that a CMH 180 flight path from 1090E or DOTEN does not match the satellite data. Therefore it appears that there is a difference between what ZS simulated and what happened in reality with MH370.
The ZS simulation was simply a fuel check on how far different fuel amounts will take you:
(1) The MH150 fuel amount.
(2) The extra fuel required to get to the Magnetic South Pole, adjusting the fuel amount after take off.
Fuel was added and fuel was jettisoned during the simulation.
@Richard:
Thanks for the document. According to table 1 and figure 7 the maximum range of both Lhokseumawe and Sabang radars were at least back then much less than the manufacturer specs. Only 60-80 nm instead of 240 nm. If this is the case, MH370 could’ve easily flown around the radar coverage. That would also explain why Indonesia apparently never detected MH370 as it flew around Sumatra.
@Arto L
The document also says that there was frequent downtime for maintenance or shut down because of the inability to get spare parts for repairs.
Either ZS had to avoid 60 – 80 nm range or had prior knowledge that Sabang and/or Lhokseumawe were not operational.
@Richard
I still think it would be strange if he had prior knowledge of the radar downtime. It was a military radar of another country after all. Avoiding the 60-80 nm range would not have been difficult however.
Arto L
You are right. Even if ZS had hearsay evidence from the pilot community that Sabang was shut down, why bother when all you have to do is circumnavigate 80 nm.
Richard- Sorry I missed all that recent discussion about the pilot’s sim studies.
Why bother go out to DOTEN to circumvent the Sabang radar? Please consider-
In the apparent MH150 simulator flight, speculating, but we do know the sim pilot is ascending to FL400 presumably analogous to IGARI, perhaps for the same assumed reason (depressurization). So if that was the case, for MH150, perhaps the pilot planned to fly out to DOTEN (AMVUR) at FL400, before turning south. That is another reason why MH370 could differ, is that the depressurization step was already completed at IGARI, thus allowing the apparent closer circumvent of Sabang.
Many of you continue to speculate about what may have been in the captain’s mind when he moved a mouse and saved files of coordinates in the Southern Indian Ocean, while he may have been planning for some flight other than mh 370 with a different route, that he didnt even bother to practice flying real time on his simulator.
Many of you speculate about what bearing he may have plugged in when he actually flew mh 370, and what was in his mind when you assume he killed himself and his passengers with premedition. If you want to avoid another fruitless search, it would be better to base identification of the search area on the debris, drift analysis, radar, Inmarsat data, and WSPR. Additionally, you and Ocean Infinity may have a better chance of convincing Malaysia to restart the search if you base your recommendation on that new credible evidence and analysis, rather than incredible speculation about how their pilot premeditated and executed a mass murder suicide.
Have anyone question this, “can someone from the aft cargo hold enter the main cabin ? “. And if it is well executed plan, would someone else have taken command of the plane?
@TBill:
It is possible that ZS only found out that Sabang radar range was much shorter than the manufacturer’s specs after the simulator flight. In that case flying out to near DOTEN would make sense. Another possibility is that he may have wanted to make the diversion out of range of civilian SSRs too. In that case going to DOTEN would also make sense. Diverting out of range of SSR instead of just switching off the transponder could have delayed the ATC response and search and rescue efforts.
@TBill, @Arto L
Banda Aceh Airport (WITT) and Medan Airport (WIMK) carried only domestic traffic in 2014 and they were closed at night. The civilian Terminal Area Radars (TARs) would be shut down at the time MH370 was in the vicinity of Northern Sumatra.
@Miden Agan
What you state about speculation on this web site is not factually correct.
There is only 1 post out of 13 posts on the subject of the Zaharie Shah’s home flight simulator. That guest post by Bill Tracy does not speculate on murder or suicide or motive. The post does however mention the lack of disclosure and transparency of the Malaysian Government with regard to the data recovered from Zaharie Shah’s home flight simulator. Bill’s focus in his paper is on what we can learn from the simulator data to help our flight and fuel analysis.
There are only 37 comments out of 560 comments that mention the simulator (7%). Analysts here do not take the simulator data as a fact as what happened on the actual flight. At the most it was a simulation of a simulation, but it could have simply been a fuel calculation check. Personally, I do not believe the data was planted to try and incriminate the Captain, nor do I believe it was left by the Captain as a false trail.
There are only 26 comments out of 560 that mention Zaharie Shah (5%). There are only 9 comments that mention motive, 11 that mention murder and 16 that mention suicide. That is not many analysts, but only a few.
On the other hand there are 13 posts and 152 comments on the flight analysis. 4 posts and 219 comments on debris and drift analysis, 2 posts and 62 comments on WSPR.
Your complaint is without a factual base and is therefore rejected. It makes me wonder why you pursue this complaint about other analysts on this web site. It would appear that you are a propaganda agent for the Malaysian Government. In any case, you have been warned not to try and use this web site for propaganda purposes and please stick to the facts in your future comments.
Miden-
Investigators have to decide if the simulator data is nefarious or not nefarious. I take the position that the sim data is probably nefarious and may yield clues to the MH370 hijack plan.
You object to that approach, I hear that. You feel the simulator data should be ignored. On the other hand, I feel the whole problem could be that we are ignoring the simulator data, and other data that infers an active pilot.
Historically, the sim data was given quite some importance as a possible passive flight to NZPG. On further analysis, I feel the sim data might actually represent an active pilot flight towards 180 South Magnetic (towards the Magnetic South Pole). I also feel that may be quite consistent with actual MH370 flight BTO/BFO/Debris Drift/etc. WSPR is too new technique to say.
@Richard
I am not a “propaganda agent for the Malaysian government”, and deeply resent your false accusation. I will not be making any future comments in your blog. You are of course free to delete all my comments that you may disagree with.
@TBill
I appreciate your reasoned respectful disagreement and discussion.
@Miden Agan
I will not tolerate attacks on other analysts on this web site, many of whom like @TBill spend many hours of their own time on research and providing insights into the search for MH370.
If you have something to contribute to the search for MH370, then your are welcome to comment, but so far you have only criticised other analysts saying that “Many of you continue to speculate” and “If you want to avoid another fruitless search, it would be better to base identification of the search area on the debris, drift analysis, radar, Inmarsat data, and WSPR.”
Further you make the case that a new search depends on Malaysia. “Additionally, you and Ocean Infinity may have a better chance of convincing Malaysia to restart the search if you base your recommendation on that new credible evidence and analysis, rather than incredible speculation about how their pilot premeditated and executed a mass murder suicide.”
MH370 is in international waters and no one wishing to search needs the permission of Malaysia under international salvage law. If Malaysia blocks a new search, if Malaysia hides the simulator data, if Malaysia fails to provide the military radar data, then they lay themselves open to suspicion. Why does Malaysia not co-operate with the search for MH370?
Hello Richard Godfrey,I am a engineer on geophysics from China. You have done a great job. I want to download the “MH370 Floating Debris Drift Analysis – 12th January 2021.pdf”, but I cann’t do this on the website. So, would you sent it to my e-mail? Thank you!
@Fei Li,
Welcome to the blog!
You can download the paper either under the post titled “MH370 Debris Drift Analysis (Updated)” in the Debris Drift section or from the Archive section.
The .pdf file is 96.9 MB so the download may take some time! It is too large to email.