(Updated 12th January 2021)
Floating debris from the crashed flight MH370 has been found and reported to the authorities in 22 locations throughout the Southern Indian Ocean (SIO). A total of 33 items drifted to these locations from the crash site, over a 3 year period. In a previous paper entitled “The Final Resting Place of MH370”, which I co-authored with Bobby Ulich, Victor Iannello and Andrew Banks, we analysed the MH370 flight path from Kuala Lumpur, Malaysia to a last estimated position of 34.2342°S 93.7875°E in the SIO, based on satellite, radar, weather, fuel and aircraft performance data. The purpose of this new paper is to determine the MH370 crash location using an analysis of the oceanic drift of these debris items, independently from any other data.
The MH370 crash location was 34.13°S ± 1.06° near the 7th Arc at a longitude around 93.98°E and the search area is defined as a circle with a radius of 65 nm centred on the crash location.
The updated paper can be downloaded here
The search for MH370 continues, and Richard Godfrey’s new dedicated website will surely be a valuable resource for all those interested in applying science-based analysis techniques to the sparse set of data that we have available, in the quest to determine as precisely as is feasible the location where it hit the sea in the southern Indian Ocean. Like Richard, I am one who does not suffer fools gladly, and since MH370 went missing there have been many fools wanting to broadcast their own particular thoughts about what happened, disregarding what we actually know for sure: the sparse data mentioned above. Doubtless many of those fools will try to comment here, but in the spirit of true science Richard will apply peer-review standards to submissions: rejecting those that do not conform with known information, whilst allowing others that offer something of value regardless of whether they are in accord with his own working hypotheses based on the information we have. This is how science should work: consider all potentially-valid interpretations, and adjust one’s own working hypotheses in line with developing understandings. I look forward to seeing what new ideas turn up here.
Many thanks Duncan for your excellent comment. Evidence of what happened to MH370 based on facts from reliable sources is required. Corroboration from multiple sources is even better. Deduction from facts is the analyst’s work. The sparse MH370 data set, which has been made available, forces the analyst to make assumptions, but these assumptions must be tested. Speculation without firm facts is an easy trap to fall into, but should be avoided. Proof of what happened to MH370 requires a verification process. I invite everyone to contribute to the search for MH370 and help find out what happened.
Richard, I applaud your establishing this website that will be focused on Malaysian 370, without being sidetracked by separate issues, conspiracy theories, and political agendas. I look forward to serious discussion and contributions about MH 370 here.
I wish you well, Richard. I think a *clean* and focused restart is needed away from the politics, agendas and side distractions. The titanic sunk. I really don’t need to know about the political or personal fascinations of those who arranged the deckchairs that night to establish what happened. It’s a hard lesson learned for some. Let’s move on and stick to facts without carrying a muddy water pale.
Welcome to the blog!
I really enjoyed your YouTube interview with Blaine Gibson. As an investigative journalist, you correctly point out that we do not yet know precisely what happened to MH370 or where MH370 crashed. As you say, it is therefore premature to conclude why MH370 disappeared and who is responsible.
Many thanks to Duncan Steel, Blaine Gibson, Andrew Banks and Dennis Workman who have peer reviewed the paper. They have made several helpful suggestions to clarify the text and spotted a number of typos, which have been corrected. The download link has been updated.
So, I just did a Weibull model of the first 27 debris finds (ignoring the towlette). The data is extremely well behaved. Y-axis is time of find in days. X-axis is simply the range (1-27). Don’t know if a simple paste will work here. Will find out.
Best fit Weibull two parameter CDF is alpha=0.28, beta=2.
https://photos.app.goo.gl/JpCMV8oQ9csa2CDi9
Excellent insight into the timing of the 27 debris finds. Your graph shows that the debris reporting delay was at most 30 to 40 days, assuming that all debris arrived close to the idealised red curve. This finding means that the debris drift analysis is a reliable indicator of the transit time across the Southern Indian Ocean. The CSIRO drift model is well founded and can be used to determine the MH370 crash latitude.
Ocean Infinity are reviewing the latest drift analysis.
Here’s hoping that 2021 will be the year that MH370 is found.
Cleaned it up a bit.
https://photos.app.goo.gl/92D1HmyuPpaKUCh69
I have included a guest paper in the Archive in the Drift Analysis section from Mike Eichhorn, which he presented at the IEEE OCEANS 2016 conference in Shanghai.
10th April 2016 – Guest Paper from Mike Eichhorn – A Debris Backwards Flow Simulation System for Malaysia Airlines Flight 370.
Mike (like Captio) favours the case that MH370 is to be found near Christmas Island.
Mike uses a combination of forward and reverse path analysis. In my drift paper I only use a forward path analysis based on the CSIRO data starting from the 7th Arc. Geomar (Backtracking of the MH370 flaperon from La Réunion – Durgadoo et al. – 2016) only use a reverse path analysis. Mike’s approach is to combine both a reverse and a forward path analysis in a roundtrip methodology. The MH370 satellite data is not used to constrain his results.
His findings are for the Flaperon and it would be fascinating to have his results for the other 31 debris items. If all debris items show a pattern or there is an obvious result from a probability density function, then that would be very interesting. It sounds like a task for an artificial intelligence application.
He excludes wind, waves, immersion depth and hydrodynamic behaviour, so an obvious question arises as to how the results would be more revealing with the inclusion of the additional data. We also do not have sea trials with authentic replicas of all the debris items.
Mike concludes ocean current models have a large uncertainty over such a long time period, so we need to exercise caution in how we interpret the results of the drift analysis.
With great interest I have read your latest drift paper from 2021/01/01 and your introduction about my paper on your web site.
Thank you for this. I want to clarify one point about my favored crash site. The area northwards the Christmas Islands near the Sunda Strait is a favorized crash site using the HYCOM models. The CMEMS (Copernicus Marine environment monitoring service, http://marine.copernicus.eu/ ) models show the highest elevation of the histograms near the Maldives and hence this is another possible crash site. Here you can see one problem in drift modeling. Ocean models can show different ocean current behavior in a few areas and time ranges although they use satellite data and in-situ data from ships, drifters, and buoys in the same area at the same time.
Since you ask for my opinion about your paper, here a few comments:
-Your used data are the result of drift path simulations from CSIRO. This leads to a limited validity of your results. Here are a few points:
1. All simulations start at the 7th arc. Your found crash site lies automatically on the 7th arc. In case that the last communication position at 00:19:37 UTC does not correspond with the crash site because the plane has more fuel than the model calculated and can fly longer (maximal shortly before the unanswered handshake request at 01:15:56 UTC), you have to use another arc (more eastwards).
2. I don’t know the CSIRO current model. On page 8 in your paper you state that the data is based on a 20 year data set (1993 to 2012) of ocean and satellite observations, a data assimilation algorithm and a 250 km domain localisation process. I don’t know how information about the ocean current situation during your simulation period from March 2014 till December 2016 are considered in the current data. In my experience (path planning for the AUV Slocum glider), the ocean current field is not the same in each year, especially in the Southern Indian Ocean (SIO).
3. The generic data set uses a leeway coefficient of undrogued drifter (1.2% see section 2.3 “Results” in [1]). In my opinion, the used leeway coefficient is too high and not usable for all found debris.
4. The second data set is based on Flaperon sea trails and has a 20° left of the wind and an extra leeway coefficient of 10cm/s in excess of the Stokes Drift. These flaperon’s drift parameters are estimated under the assumption that a debris that started between 40°S and 30.5° on the 7th arc arrived at La Reunion at the end of July 2015 (section 5 Conclusion in [1]). This works only if the assumptions about the 7th arc and the 40°S -30.5° range are correct.
5. Both data sets are adapted for the Flaperon found in La Reunion. All other debris have other found positions and dates as well as other shapes (excluded C23). The used leeway coefficients in both data sets cannot be used one to one for all other debris.
– The section 6.1 “Debris Arrival Time” is really helpful for future analysis to define the time period where the debris were stranded.
[1] David Griffin, Peter Oke and Emlyn Jones, The search for MH370 and ocean surface drift – Part II 13 April 2017
@Mike Eichhorn
You suggest MH370 may have continued on beyond the 7th Arc, if there was sufficient fuel. In my view, the Satellite Data Unit (SDU) log-on request sequence at 00:19:29 UTC was the result of a power up reboot following fuel exhaustion at ca. 00:17:30 UTC.
In addition the IFE connection transmission from MH370 approximately 90 seconds after the SDU log-on sequence was completed at 00:19:37 UTC was never received at 00:21:06 UTC at the ground station in Perth, Australia as expected.
The ATSB state, that the fact that the expected IFE system transmission was not received could be due to:
• the IFE system being selected off from the cockpit overhead panel at some point after the 18:25 logon
• the IFE and/or SDU unit losing power (APU flame-out), or
• the IFE and/or SDU becoming inoperative (due to impact with the water) before the
connections could be set up, or
• an unusual aircraft attitude breaking the line-of-sight to the satellite (aircraft transmission not received by satellite).
I am a bit baffled by your 7th arc starting point comments. That the termination occured very close to the 7th arc seems axiomatic to me. In the context of the accuracy of drift predictions it is hard for me believe that using a slightly greater arc radius would influence on the results.
@DennisW
If Richards assumptions in the post above are correct, then the plane should crash near the 7th arc.
I wrote a MATLAB function to calculate the 7th arc using a ping ring model presented on this page
http://www.aqqa.org/MH370/models/
The MATLAB function BTOBingRingFunction.m is in this folder
https://www.dropbox.com/sh/tk8qzsbtkh6ui6f/AADpXV28dRNnKWoAyRP0CKYUa?dl=0
Please feel free to use the function and change the input parameters.
You can change the timeUTC, the bias, the BTO value as well as the altitude to analyze the sensitivity of these parameters in the arc calculation.
My experience with drift simulations is that the results can vary by hundreds of kilometers. From this point your assumption about the accuracy of drift predictions is correct. It would be interesting to use a greater arc radius and repeat the drift simulations. The result can help to make assertions about the robustness/stability of the current conditions in the SIO around the 7th arc.
In the drift paper posted above, I conclude the crash location is within 65 nm of the Last Estimated Position (LEP).
The Boeing end of flight simulations position the crash location within 32 nm of the 7th Arc.
In a comment above, I conclude the crash time is most likely between 00:19:37 UTC and 00:21:06 UTC.
The CSIRO drift data covers the 7th Arc from 8°S to 44°S with a search width of 30 nm, which is 9 nm inside (West of) the 7th Arc at 20,000 feet and 21 nm outside (East of) the 7th Arc at 20,000 feet.
Because of the slope of the 7th Arc, the actual East-West width of the CSIRO drift start points is 30.3 nm at 9°S and 41.9 nm at 40°S.
The CSIRO drift start points are arranged in a pattern of circles.
Here is a plot of the drift start points at around 9°S.
https://www.dropbox.com/s/ten76t08h995gyy/7th%20Arc%20Width%20at%209%C2%B0S.png?dl=0
Here is a plot of the drift start points at around 40°S.
https://www.dropbox.com/s/i8d6y1vevavq1vx/7th%20Arc%20Width%20at%2040%C2%B0S.png?dl=0
@Richard
To validate the significance of your results I wrote a MATLAB script splitDataset.m which can split your used data sets from CSIRO in two parts. See:
https://www.dropbox.com/sh/tk8qzsbtkh6ui6f/AADpXV28dRNnKWoAyRP0CKYUa?dl=0
Using the method “arc” splits the data set in two parts, one lies westwards of the 7th arc and the other one lies eastwards (see also figure arc.pdf). This is a good test to validate the assumption from @DennisW about the radius size and its influence on the results. The found crash position using the two separate data sets should be similar. The script also includes two additional methods “circle” and “mixed”. You can see how it works in the corresponding figures. More details you will find in the script.
I also have a suggestion for your web site. To find all required information to calculate the 7th arc I need a lot of time. Can you publish the used models from the aqqa web site on your web site or a link to this site? Can you also publish your used debris as Excel or MATLAB table on you site? This can help new researchers to have an easier access to this research field.
Thank you for your paper Richard, with its innovations and explanations. Below I have made some comments. What troubles me is whether the field drift data on which it is based are too approximate to support some of your analysis.
Since my Dropbox and Windows 7 are not in accord, the below and/or its own Dropbox items may not work, in which case I will have to think again.
https://www.dropbox.com/s/2e76kr6wgayo8i7/Comments%20on%20Richard%20Godfrey.docx?dl=0
@David
Many thanks for your detailed comments and questions on the drift analysis paper. I recommend all readers interested in the drift analysis to take a look at your linked document. I will try and answer your points in due course.
You raise some important issues regarding the limitations of the drift analysis, the validity of near shore sea trials versus mid Indian Ocean trials and the need for specific trials with authentic replicas of more debris items other than just the Flaperon.
You also consider the implications for any possible future search and additional work required before embarking on any further search, to ensure Ocean Infinity are successful in finding MH370.
I would be interested in your view, how you would weight the previous search results versus the flight path analysis, fuel analysis, debris drift analysis and hydroacoustic, seismic and infrasound analyses.
Thank you Richard
Weighting.
The effect of the previous search I see as being a separate issue to the selection of suitable candidates.
As a stab at suitability criteria, they need either:
• to satisfy the BTO and fuel criteria and also demonstrate that the performance of the aircraft, its systems and personnel onboard match all hypothesised events and,
• to be consistent with BFO and drift data and,
• not contain any unreasonable assumptions or inconsistencies of logic,
or else:
• strong other evidence of a crash site,
• to be consistent with BTO and fuel criteria and also demonstrate that the performance of the aircraft, its systems and personnel onboard match all hypothesised events and,
• to be consistent with BFO and drift data and,
• not contain any unreasonable assumptions or inconsistencies of logic.
I believe the UGIB hypothesis is the only one that could meet the above criteria so there is no need for weighting in the ranking of candidates.
The decision whether or not to search is where the effect of the previous search should come in, IMO. How high the probability of success of a new search needs to be depends on the cost of the search and what might be gained from it.
I will go into this more and post any outcome that may be of interest.
@David, you seem to be implying that UGIB is
• …consistent with BFO and drift data and,
• [does] not contain any unreasonable assumptions or inconsistencies of logic?
Allow me to make the following observations:
1840 BFO
– the 1840 BFO can only be reconciled with UGIB’s proposed path by introducing a descent
– yet the BFO data is too smooth to be consistent with anything other than level flight (ref SK999)
– that makes that bit of their path incompatible with 1840 BFO
– and it lends considerable credence to the view that the plane had already turned south before 1840.
end of flight
– the area close to the arc at the recommended latitude has already been thoroughly searched. You’d have to have been quite unlucky to have missed it
– if you infer that the latitude must be correct but at much greater distance from 7th arc, you are throwing out the final BFOs and/or invoking an improbably glide beyond the final SDU datapoints
fiddling and diddling
– the only way you can reconcile 35S with the last known position by radar is to introduce a significant loiter. that can’t be ruled out. but is unnecessarily complex and stands in stark contrast to the apparently “steady” flight from 1941 onwards. If you posit steady AP flight for the last 4:39, why not for the last 5:45?
I return to the observation that used to be a favoured mantra of Duncan et al. The BTO is the best data we have. If we had ignored drift, the “first principles” review would have recommended 39S over 35S.
It remains unquestionable that the most parsimonious path solution (single turn on to a great circle path) also happens to produce the best BTO fit of all paths published to date. That path meets 7th arc between 39.5 and 39.9S. This solution is largely insensitive to assumptions about the speed or track angle prior to FMT.
@Paul Smithson. Clearly put thanks.
‘BFO’. I put my once-close familiarity with that subject in a locker somewhere and haven’t seen it since. Whether UGIB is ‘consistent with’ BFOs or, as you say, ‘incompatible with’ them I leave to others.
‘End if Flight’. I see candidature as getting through the gate and there is just the one right now that could. Please correct me but I do not think you have found the fuel to get to 39 – 40 deg S.
Already searched. I do think the low probability of a find (Bayes, courtesy @DennisW) in the proposed area is one for the searchers and does not rule out a candidate. If the probability does not match the gain vs cost, no search. (Gain comes in 3 parts as I see it; business, closure to next-of-kin, to aviation, though not necessarily in that order.)
As to the probability, were I Ocean Infinity, I would approach the quality manager(s) of the previous search about the chances the wreckage was missed, and then review the inputs to Bayes.
‘Fiddling and Diddling.’ I cannot comment.
Returning to errors of logic, I said UGIB “could” meet the criteria, as distinct from ‘did’ meet them. I for one have two niggles with it. I think a pilot aiming to conceal his suicide would be intent on doing what he could to assure he wasn’t spotted in the final descent. Moreso I think than on saving a bit of fuel by turning off the packs prior to a much earlier suicide. Also, the notion that the pilot slumping at the controls, that making the final descent compatible with the descent’s BFOs, is questionable. Were he to slump like this surely it would be when he was supple, some hours before well-below-freezing set in. That would have disconnected the autopilot.
@David
Thanks, nice review. Do you believe drift testing now (seven years after MH370 loss) using representitive sample drifters would be a worthwhile experiment? I have no idea how ocean behaviour evolves over time, but several investigators are reporting an increase in current speed likely due to climate change.
@David
Many thanks for your reply comment on the weighting of the various analyses in determining suitable candidate crash locations.
The UGIB hypothesis has been critically reviewed by a number of analysts, who have pointed out, what are in their view, a number of weak points (list may not be exhaustive):
1. The Kate Tee sighting is unfounded speculation and some analysts claim that the sighting was a fabrication or unreliable.
2. The zig-zag FMT path following FIR boundaries is unfounded speculation to fit the Kate Tee sighting.
3. A descent during the FMT to avoid radar or other traffic is perhaps justified speculation, but has been criticised by some analysts.
4. Switching off the air conditioning packs, cabin depressurisation and flying at a very high altitude following the air turn back are speculation.
5. The overall fuel model is significantly affected by these various speculations (Air Turn Back climb to high altitude, FMT route, turns, descent to low altitude and climb back to cruise altitude, air conditioning packs).
6. Whether there was an active pilot or no active pilot until the end is speculation.
7. An unpowered glide and ditching with an active pilot is speculation and is contra-indicated by the state of the debris found.
8. Hydroacoustic, seismic or infrasound detection(s) were excluded, and there may be some useful facts to be gleaned from the data.
Yes there will always be dissent and uncertainty but as to whether they disqualify the hypothesis or not that was the genesis of my attempt at an objective list of criteria.
About your 4 and 5 by my last para to @Paul Smithson above (at 00:05) is about some related reservations I have. However I would not characterise them as disqualifiers, just arguable opinions.
@DennisW. Thank you. The object would be to check, refine and complement the earlier CSIRO comparative velocities of the GDP drifter, undrogued with the various items of wreckage recovered, in various conditions, for use in the 2014-onwards model conditions.
While a possible option, the gain may not be worth the effort entailed or be practicable. @Richard’s response might help with what that gain might be and @Dr B’s work on drift could well have a bearing.
@DennisW. I believe that a drift model must use epoch-specific weather and current models to be valid.
However, what could be done even now is to validate the leeway factors of actual pieces of aircraft debris. In my view, there is a high likelihood that the composite sheet debris would be found to have much greater leeway than an undrogued drifter and would also likely drift at a different angle to wind. It is well established that leeway is affected by draft of an object (even down to the last 5cms of depth). In short, the entire surface film of water is on the move, with the speed and direction of movement changing as you go deeper. Even quite small differences in assumed leeway factors (both speed and direction relative to wind) can make a very large difference to drift simulation.
Having said this, I’m of the view that even with a properly calibrated drift model, the results are simply too “fuzzy” to be useful, except, perhaps, to exclude extremes. This view has been reinforced by reading Richard’s results, which show very broad distribution of possible latitude origin for all finds. Taking the mode/median of each and combining multiple debris finds is obviously better than working from a single object. But I cannot see how RG has taken account of the very broad confidence intervals attached to (inferred latitude of) each item found.
Paul, I share your view of the ability of the drift analytics to home in accurately on originating latitude. The dispersive effects of the tropical storms in the drift area between the crash date and the time of the debris finds are particularly troubling. RG’s report is pretty amazing, however, and his analytical pedigree is well established. It will be interesting to see the upcoming DrB report.
@Mike
The 7th Arc data is well established and there is a long history involved. I refer you to the Chronology, where you will find reference to a number of the Independent Group (IG) members who contributed including Barry Martin, but also Duncan Steel, Mike Exner, Victor Iannello and Henrik Rydberg.
I appreciate your Matlab function BTOBingRingFunction.m, but please bear in mind that not everyone has access to a free of charge academic license for Matlab including the Mapping and Aerospace toolbox add ons.
I chose to use Excel for my MH370 Flight Path Model Version 16 which is available for download on the Archive page and contains the Inmarsat 3F1 Ephemeris in the tab “Satellite Data” and the Inmarsat Signalling Unit Log in the tab “MH370 Data Communication Logs”, because Excel is widely used. I am now on V19.8 with many changes to the flight model, navigation options and fuel model, but the core data remains the same,
Many thanks for the splitDataset.m function which I will use to investigate the radius size and its influence on the results.
The MH370 floating debris data can be found in the following link:
https://www.dropbox.com/s/m7fblqifyy0w9nu/Debris%20Observed%20Reports%20Overview.xlsx?dl=0
@Richard
Thank you for your hint about the required additional toolboxes in MATLAB. I have changed the code so that it runs without toolboxes. I also have changed the function name from BTOBingRingFunction.m in BTOPingRingFunction.m:
https://www.dropbox.com/sh/tk8qzsbtkh6ui6f/AADpXV28dRNnKWoAyRP0CKYUa?dl=0
@paul smithson
You commented that the BFO data during the first call is too smooth to be consistent with anything other than level flight (ref SK999).
The Malaysian Military Radar trace shows a flight path following flight route N571 via waypoints VAMPI and MEKAR at a ground speed of around 509.3 knots. At an altitude of 36,000 feet this equates to Mach 0.85, given the winds and air temperature.
We know that MH370 did not continue on flight route N571 much beyond waypoint NILAM, as the BTO and BFO errors are too large.
Assuming MH370 made a turn at waypoint NILAM, one possibility that fits the satellite data is a track to waypoint SAMAK on a track of 300.0°T. To match the 51 BFO data points during the 1st call in level flight at 36,000 feet and a speed of M0.85, would require a track of 208.1°T.
Please see the graphic in the following link:
https://www.dropbox.com/s/6ugibjigxnuqjrn/MH370%20Flight%20Path%20-%20Final%20Radar%20Capture%20-%201st%20Arc%20-%201st%20Call.png?dl=0
@Richard. Your graphic indicates a turn to the SW that has happened “just in time” for the BFOs around 1840. However, it appears to be an instantaneous turn. At 483 TAS and 15 deg angle of bank a turn through 100 degrees takes 165 seconds. If Samak is the WPT used for the turn, then turn should start 82 seconds earlier, or about 18:38:35. By the time of the SAT call, you are already well into the turn and BFOs would not be compatible.
@paul smithson
Many thanks for your comment. I admit that I had idealised the graphic based on the assumption of maintaining a speed of M0.85 and an altitude of 36,000 feet. The graphic was supposed to be illustrative of a point, that I was trying to make and not an actual flight path.
With a slightly higher ground speed between the 1st Arc and the 1st call, MH370 could easily arrive in the vicinity of waypoint SAMAK to complete the 92° turn at a 25° bank angle in 88 seconds. If the turn is to be completed by 18:39:55 UTC, it would have to be started by 18:38:27 UTC around 7.3 nm before waypoint SAMAK. The implied ground speed from the 1st Arc on the basis of these assumptions is 523 knots.
This is all speculation, because we do not know how soon after the final radar capture a turn took place and what the speed and altitude actually was. All I am saying is that SK999’s hypothesis of a level flight during the 1st call fits the 1st Arc BTO and BFO data and a turn south-westwards fits the BFO data during the 1st call in general terms.
Hi Richard, thanks for the response. 523kt groundspeed from Arc1 to the start of a turn at SAMAK is more than Mmo. Which makes this hypothesised path rather unlikely and not at all “easy” for MH370 could easily arrive in vicinity of WPT SAMAK…by 18:38:27. Ergo, turn must have occurred at a point further east.
But I think we are agreeing with one another that BFOs at 1840 were more likely associated with a trajectory southward than “westward plus descent” (which is what I understand was postulated in UGIB).
@paul smithson
I agree that the turn southwards is much more likely to have occurred further east of waypoint SAMAK and the 51 BFOs during the 1st call more likely indicate that MH370 had settled in a level flight with a constant track, rather than in the midst of a descent.
To reconcile an more easterly turn position with 35S terminus still requires killing a good deal of time between 1840 and 1941. So a necessary corollary of your proposed terminus is a massive slowdown in speed and/or some “detours” with minimal velocity-made-good in order to arrive at Arc2 on time. Like any of these hypotheses, we can’t prove it didn’t happen, but….
Its true in general all 180S paths, including Captio which starts out as a 180S path, end up at 2-3N above ISBIX at 1941. It does not matter too much how you get there. So there have been a wide variety of creative proposals. Might make a good paper actually, to sum them all up.
I suppose the general logic is some degree of fake-North switchback and/or radar fake-out maneuver. somewhat like IGARI but unlike IGARI, we have to guess what was done. Also re: radar we had the Singapore AWACS aircraft up there in the mix.
If I can say CAPTIO is psuedo-180 South, we really only have two flight path start options being advocated these days:
(1) The “Get Out of Dodge” Fast No Loiter to 38-40 South
(2) The Not-so-Fast “Loiter” to 180 South
So we have many guesses at the loiter structure. But I don’t see at as a big weakness, if it happened somehow. Guess its about 20-30 minutes slower to ISBIX.
@All,
I have run the Matlab scripts kindly provided by Mike Eichhorn.
David Griffin of CSIRO kindly provided two data sets, one for the Flaperon incorporating the specific windage of the Flaperon from the sea trials, the other for Generic debris items, which are assumed to drift like undrogued drifters.
Mike’s scripts split the data sets, with 86,400 trials each, into two halves using 3 different methods:
(a) splitting the even and odd number trials.
(b) splitting the small and large circles of trials.
(c) splitting the trials starting West of the 7th Arc from those starting East of the 7th Arc.
The idea is to see whether the results favour trials that originate closer or further away from the 7th Arc or inside to the West or outside to the East of the 7th Arc.
Below is a link to the results table for the C2-Flaperon found in Reunion and the C23-Outboard Flap found in Tanzania.
https://www.dropbox.com/s/yosaczpezszh5a1/Trial%20Splitting%20Results.png?dl=0
@Richard
What is point of the even and odd split?
@DennisW
I had assumed that Mike’s intention was to create two pseudo-random data sets, of 43,200 trials each, in order to compare the results and see if the two data sets aligned.
Another way would be to make a random selection of 43,200 trials and compare the results with the remainder.
@Richard
Your assumtion is correct. Using a random selection is a good idea and the common way in statistics.
@DennisW
Additional to the idea to analyze the influence/sensitivity of the drift simulation on the start positions (assumed crash positions) along the 7th arc was an idea to validate the significance of the results, using split data sets. The existent structure of the data set allowed an easy splitting in inner and outer circles and two data sets with a similar start position distribution (even and odd numbered trials).
Using multiple data sets is a common method in statistics to validate the significance of results. This method is also used in machine learning, where the data set will be divided into two subsets a training set and a test set. The even and odd split is a possible method to create data sets with similar characteristics. If the model is correct, the results (here the estimated crash position) should be similar using such data sets.
@All
Mike Eichhorn states is his paper “In conclusion, the used ocean current models have a large uncertainty over such a long time period. The area of interest, the Indian Ocean, has a complex flow structure characterized by eddies and tidal ocean currents in shallow water areas. Furthermore, the HYCOM and CMEMS models show a different ocean current behavior in a few areas and time ranges. All these facts should be taken into consideration when interpreting the results.”
The preliminary results of the data splitting exercise for just two MH370 floating debris items show a mean crash latitude of 34.5°S and a mode crash latitude of 35.4°S but a large standard deviation of 2.7° for the Flaperon and even larger for the generic data of 7.9°.
Both Mike and David have raised the question of whether it is a valid assumption that all the MH370 floating debris (apart from the Flaperon) behaved like generic debris or undrogued drifters. To put the question another way, are the Flaperon results the only reliable drift analysis results?
I will nevertheless extend the data splitting exercise in due course to include a large number of debris items.
In my comments to you I noted that besides being constrained by resources and times, “They were looking for consistency with the flaperon find, as distinct from further accuracy.” That is unsupported by their documentation so I have now deleted it, while also making some minor editorials for readability.
You say, “To put the question another way, are the Flaperon results the only reliable drift analysis results?” I do not think they are reliable.
@All,
I owe you an apology for two errors in the drift paper, which have led to misconceptions. The paper has now been updated to clarify these misconceptions.
@Mike Eichhorn wrote “On page 8 in your paper you state that the data is based on a 20 year data set (1993 to 2012) of ocean and satellite observations, a data assimilation algorithm and a 250 km domain localisation process.”
@paul smithson wrote “I believe that a drift model must use epoch-specific weather and current models to be valid.”
@DennisW wrote “The dispersive effects of the tropical storms in the drift area between the crash date and the time of the debris finds are particularly troubling.”
The statement on page 8 has been corrected and now reads: “The CSIRO data, originally based on a 20 year data set (1993 to 2012) of ocean and satellite observations, has been updated with epoch relevant data for 2014 to 2016, a data assimilation algorithm and a 250 km domain localisation process.
The statement on page 10 has been corrected and now reads: “The CSIRO model does not completely account for Tropical Cyclones.”
A clarification has been added on page 10 “Although tropical cyclones are not completely accounted for due to limitations of the global models used, within the geographic boundaries and timeframe of the CSIRO data model, the effects of winds and waves generated by tropical cyclones are included in the data models used.”
The Executive Summary has also been updated accordingly.
@TBill
You wrote: “I suppose the general logic is some degree of fake-North switchback and/or radar fake-out maneuver. somewhat like IGARI but unlike IGARI, we have to guess what was done. Also re: radar we had the Singapore AWACS aircraft up there in the mix.”
You make an important point about the Singapore aircraft. There was the infamous “yellow pin” in the appendix to the first Malaysian report, marked on a map of the Andaman Islands but in the middle of the sea with a black circle around it with a range of 130 nm.
https://www.dropbox.com/s/gwafdzsi3o6o2y5/Yellow%20Pin.pdf?dl=0
Later the ATSB talked about a NW Point at 19:12:00 UTC in their first report and Niels Tas wrote to the ATSB and was given the position as 8.595317°N 92.585750°E. There was talk that the “yellow pin” or NW Point at 19:12:00 UTC was the Singapore aircraft and the black circle was its radar range. Since the Singapore aircraft apparently did not pick up MH370, can we assume that MH370 must have turned south-west before it came within range?
If this NW Point was the position of the Singapore aircraft at 19:12:00 UTC and the black circle was the range of its radar, then it strengthens @paul smithson’s argument that the turn south-west had to take place before, say 18:37:15 UTC to allow time for the turn and settling in to a constant track before the 1st call.
This is all speculation, but waypoint MEMAK might line up with such a flight path.
https://www.dropbox.com/s/pa0o04izwjkui1a/MH370%20Flight%20Path%20-%20Final%20Radar%20Capture%20-%201st%20Arc%20-%201st%20Call%20-%20NW%20Point.png?dl=0
For information, the path solution that fell out of my analyses aligns with IGEBO-RUNUT.
The pilot must have known the Indonesian Military 233 IIRC radar station, which is a Thales Raytheon Systems TRS 2215D, located at Northern Point on Sabang Island (5.887429°N 95.228416°E) at an altitude of 464 m was not operating that evening, because the IGEBO-RUNUT flight path passes right overhead.
I don’t think that necessarily follows and we should be careful making assumptions about what the pilot did or did not know. Airline pilots are not generally aware of the specific location of radar sites along the routes they fly, particularly military sites. The pilot might not have known about the Sabang radar, let alone its operating hours.
Captio’s proposal for 1822 to 1941 is well thought out, of course I am not suggesting anyone really knows.
Your UIGB report makes the point whether you fly around at high alt, or descend and go more directly to ~ISBIX, it does not matter too much re: fuel given 1941 time is set in stone, you gotta get to the church on time.
The other factor comes in the some folks are adhering to Brian Andersons rule of thumb. But I think if you can fly it properly in a flight sim, then it is probably possible to do.
Right now I support the aircraft ended up 32S, but if I thought there was some way to take Paul’s route outbound, and ride the high winds back to 32S, I would take it.
@TBill
It is important to know the whole flight path in order to determine the fuel usage. We know that fuel exhaustion most likely occurred at 00:17:30 UTC, so we know the fuel endurance.
To be able to better discriminate the location of the fuel exhaustion, we also want to know the fuel range and this depends on the flight path flown, including at the air turn back, the FMT and the SIO.
The fuel range will depend on head winds or tail winds encountered, the distance flown, the altitude flown and any step climbs executed, the air temperatures encountered, the selected speed mode, the selected navigation mode, the status of the air conditioning packs and many other factors. Every descent, every climb, every turn, every diversion or holding pattern will affect the fuel usage. Single engine operation and duration, as well as APU usage in flight will affect the fuel usage.
Takin up your analogy, it is not just a question of getting to church on time, or more precisely getting to several churches on time, but in what state we arrive at and depart from each church. There are different kinds of churches, some who believe in BTO and some who believe in BFO or both. There are churches where they adhere to waypoints and those that go their own way. There are windy churches, quiet churches, cold churches, hot churches, slow churches, fast churches, fundamental, scientific and speculative churches. There are churches with a pilot and churches without a pilot. There are churches with no particular belief. There are different views about each of the churches.
Not quite overhead, but certainly close. The links illustrate FMT solution as a function of Arc1 crossing latitude, alignment with IGEBO-RUNUT, and close up of both waypoints so that you can judge how close they pass. Best alignment for IGEBO – RUNUT would be produced by a path that crossed Arc 1 slightly north (about 7NM lateral offset) of N571
FMT https://drive.google.com/file/d/1XEOaYT1xmSOvknT5sYEKrwrER5QLgf9e/view?usp=sharing
IGEBO-RUNUT https://drive.google.com/file/d/1WCvWH-FI5J6LpRCpccGcwuKfD5gz8l81/view?usp=sharing
IGEBO and radar close-up https://drive.google.com/file/d/1kwv5N0AATjC8o0SDlVJq61lIFXfCoPpx/view?usp=sharing
RUNUT close-up
https://drive.google.com/file/d/104gVVj6M5Yz1XVOhaHWmaqnGfdh9CT5w/view?usp=sharing
@Richard. I have asked Dr David Griffin of CSIRO whether he would comment on the points I made to you about your drift paper, on 9th January at 12:19.
A summary of his response, is, in my words:
• The CSIRO was not looking for consistency with the flaperon find. Their aim was to build a drift model as accurate as possible, given resource and time limits.
Accordingly, as above I have deleted reference to their seeking that consistency.
• Other than that he agreed generally with my comments to you, though he did not support fitting curves to the genuine-flaperon data, saying that:
– They chose a linear fit of drift speed and angle vs wind speed because the data were too noisy to do a polynomial fit.
– The scatter in results stemmed mainly from non-collocation of the items, causing relative movement due to small eddies.
– The flaperon did outpace drifters in nil wind, probably because residual wavelets had a greater effect on it because of its shape.
• Also:
– He agrees that more sea trials, including of the right outer part flap, would be good but a quicker next step might be to utilise their new BRAN2020 model.
– However since there is no sign of interest in a resumed search he has not looked into doing that.
– In amplification, in subsequent discussions he has stressed that different models, including those overseas, yield different outcomes, as do weather forecasting models.
As to BRAN2020 he says drift results from that most likely will be substantially different to those to date. I suppose he could leave out the item with the most dubious data, the right outer flap part, were there incentive to try that new model.
– Fig 3.2 of Part 2 of the CSIRO report does not look to him to discriminate latitude other than to 3 zones; south of 39˚S unlikely, 39˚- 31˚OK and for 30˚ – 26˚ the timing is wrong. He did not think that looking at individual pixels was defendable, taking model errors into account
– The flaperon beached where it did, but had there been 10000, ocean dispersal would have spread them over hundreds of kilometres, so one should not read too much into where any one particular flaperon beached.
@David
In an email to David Griffin dated 14th December 2020, I wrote: “I would be interested in the latest data, based on the BRAN2020 ocean model, but appreciate this would be a lot of work to provide.”
Ocean Infinity do have interest in a further search and if there is a much better ocean model available for the drift analysis, then in my view it should be used.
If the search area using the BRAN2015/BRAN2016 ocean model can be reduced to 31°S to 39°S, it may be possible to reduce the search area limits further with BRAN2020.
@TBill, @Paul Smithson
The NW Point is unlikely to be the last possible turn point southwards as the ATSB proposed, because it is only 254 nm from the final radar capture and would imply an average ground speed of only 306 knots to reach the NW point by 19:12:00 UTC.
I double checked the original map in the first Malaysia Report appendix and there is just a yellow pin at the NW Point and no circle showing a range.
https://www.dropbox.com/s/gwafdzsi3o6o2y5/Yellow%20Pin.pdf?dl=0
The Singapore aircraft, which may have been located at the NW Point at 19:12:00 UTC was a Gulfstream G550 CAEW which came into operation in 2012. The airborne radar is an IAI EL/W-2085 which is an active electronically scanned phased array system, with a maximum range of 243 nm (or 450 km). It is disappointing, that we do not have the full track of the Singapore Military aircraft but I guess that is only divulged to the relevant authorities on a need to know basis.
@paul smithson’s hypothesis is that the turn southwards was soon after the 1st Arc was passed at 18:28:15 UTC towards waypoint IGEBO. If MH370 continued at the same speed and altitude, then it would pass waypoint IGEBO before the 1st call and a turn to waypoint RUNUT would not fit the BFO during the 1st call. However, if MH370 continued past waypoint IGEBO on the same track, then that does fit the BFO during the first call. @paul smithson’s hypothesis of waypoint IGEBO fits the data.
Continuing on the same track would take MH370 next to waypoint BULVA and out of range of the Singapore aircraft at 19:12:00 UTC.
https://www.dropbox.com/s/j0smd9wihljejhz/MH370%20Flight%20Path%20-%20Final%20Radar%20Capture%20-%201st%20Arc%20-%201st%20Call%20-%20NW%20Point%20-%20IGEBO%20-%20BULVA.png?dl=0
Richard, I’m unclear why you are so insistent that 1840 must signify SW (or a specific track angle). It is very clear from DSTG Fig.5.6 that 1840 BFO (assuming no bias drift/distortion) is consistent with anywhere between about 140 and 220 degrees, if we consider error margin of +/-7Hz and a range of possible speeds. Per DSTG, zero error for speed of 500kt occurs at about 150 or 210, but throughout the intervening range predicted error is <7Hz. It is certainly not correct to assert that BFO 1840 unequivocally indicates a path SW. All that we can conclude definitively is that it is "southward" and is not consistent with track angle at 182815.
If my path solution were the true/actual path, then the BFO residual at both 1840 and 1941 would be about -6Hz, then the residual reverses and becomes progressively positive.
BFO 1840 https://drive.google.com/file/d/1j77aOaNfcrrmpNo35OeZkPfrKxQpObqY/view?usp=sharing
BFO 1941 https://drive.google.com/file/d/1vCkFy0FYhs53oVZMz6nQj69csnfQk73I/view?usp=sharing
@paul smithson
I was not commenting about the generic set of possibilities that the BFO data might match, where you are absolutely correct to point out the wide range.
I was talking about your specific hypothesis and concluded that the BFO data matched your path from the 1st Arc to the waypoint IGEBO. In my calculation the BFOe was close to zero.
I complement you on finding a MH370 flight path that matches the BFO data.
I also made it clear in my comment, that a further turn towards waypoint RUNUT is only possible if MH370 slowed down after the 1st Arc.
Each time I make a statement in this regard, it is based on a specific calculation using the position, speed, altitude, track and ROC data. My statement is not based on the generic set of possibilities.
@Richard, per my hypothesis, there’s no further turn (or slow-down) after the FMT (or after IGEBO). It is M0.84, FL340 all the way. Great circle, initial bearing 190.6.
Note, the solution I have proposed was not derived from a waypoint assumption but from determination of best FMT timing. The alignment with wpts IGEBO-RUNUT only became apparent after the solutions had been derived.
The BFO match for this path is actually not very good, if we believe the bias as determined, the satellite ephemeris assumptions and zero bias drift. According to DSTG, my 1840, 1941 BFO residuals are nearly 2-sigma away from expected and the 2240, 0011 are more than 2-sigma away (in the opposite direction). It is my firm belief that there must be a systematic distortion of the BFO. And I feel that attempts to match the BFO as well as BTO is what has led us away from the best (BTO-fit, single turn) solution – which lies further south.
As I have pointed out previously, DSTG’s pdf “sans-BFO” peaked between 39 and 40s. The unimodal pdf with peak nearer 38 came about once solutions were optimised for BFO and BTO (normalised) residuals combined.
If I were to speculate on why the BFO wasn’t well-behaved as usual on MH370, I’d put my money on small error in the satellite ephemeris. I expect that the elevation (lat/long of sub-satellite point) is very accurate, but the altitude might not be. You only need that to be out by quite a small amount to generate BFO errors. A good test of this would be validated BFO residuals of contemporary flights connecting through the same satellite. There are also alternative explanations for a poorly-behaved BFO, including bias drift or changes in the ambient temperature in the cabin.
@Paul
Nice.
As you know, I am not troubled by BFO misfits. Bias drift and environmental influences can easily produce BFO changes unrelated to satellite and aircraft motion.
@paul smithson
I was responding to your hypothesis “For information, the path solution that fell out of my analyses aligns with IGEBO-RUNUT.”
It was quite clear that “Note, the solution I have proposed was not derived from a waypoint assumption but from determination of best FMT timing. The alignment with wpts IGEBO-RUNUT only became apparent after the solutions had been derived.”
The fact that you were not looking for a waypoint solution, but it “fell out of your analyses” makes it all the more interesting.
We only need now to find sufficient fuel to get to your hypothesised MH370 end point.
Meanwhile Tom Kunkle will give you another reason why your MH370 end point is also his preferred solution.
@Richard. Exactly.
For ease of reference – please see at the link a closer look at the terminus latitude pdf with/without BFO according to DSTG 10.3. I have added a one-degree scale to the figure.
https://docs.google.com/presentation/d/1FoCnFGNcj4G_1GP25d2VGpeEIOhyhFWsqwmaes_Piqk/edit?usp=sharing
@paul smithson
The DSTG in their book “Bayesian Methods in the Search for MH370” on page 58 state they assumed “Infinite fuel”.
I stated “We only need now to find sufficient fuel to get to your hypothesised MH370 end point.” I have a few ideas, how this can be achieved.
Thanks for the positive reception. I’m certainly keen to hear your fuel ideas. There’s about a 6% deficit. That leaves you at least 30 mins short of 00:17:30. With a deficit this big the list of possible explanations is fairly short.
On solving the fuel deficit.
Using Bobby Ulich’s fuel models from 1707ff, expected fuel exhaustion for this path should occur around 23:35 with packs on, or 23:42 packs-off. Note, we don’t even need to rely much on BU modelling, we can read 18:00ff off the M0.84 tables. Not clear how you could possibly get fuel endurance beyond 23:45. Continuous cruise power to 00:17 implies an error in fuel consumption estimate of ~6%. Minor amendment to speed/altitude assumptions between 17:21 and 18:28 make no significant difference to this conclusion. So how can such a large gap be reconciled?
MORE FUEL AVAILABLE
There was much more (measured) fuel on board. Reject: ACARS doesn’t lie
Significant accessible fuel in main wing tanks beyond calibrated fuel=0 (“unusable fuel”). Or significant fuel in centre tank not cleared at prior scavenge auto-shutoff, accessed by turning all pumps on at fuel low warning. Reject: Definitely some, but in order of 100s of kg, not 1+ tonnes.
CRUISE CONSUMPTION << MODEL
The published fuel tables are grossly conservative and/or the application of 3% per 10 degree TAT correction is wrong. Reject: unlikely to be “very wrong”.
Step climb(s). Possible but counter-indicated by BTO. If it did happen, can’t be significantly earlier than 2241. FF at altitude ~FL420 saves 12% fuel compared to FL340, so 1 hour of that saves a few %.
IDLE DESCENT
Idle descent adds 20+ mins to powered flight time. Entirely possible. Published idle descent profiles provide 23-27 minutes flight with fuel consumption of ~600kg. If not programmed in advance, requires initiation of idle descent when fuel low warning occurs. Logical if pilot intent to extend duration of powered/controlled flight. Must occur pre-00:11 since BFO incompatible with idle descent.
MAIN ENGINE FUEL EXHAUSTION PRIOR TO 00:17:30
One engine operation procedure requires APU on. APU runtime of 15-25 minutes after MEFE is possible (residual fuel plus fuel in line). Moves earliest time of MEFE 00:11 but requires final power-cycle to be obtained by final APU re-start. Depending at altitude, “powered glide” (APU running) could extend for significant period.
CONCLUDE: combination of factors above could provide continuous electrical power until ~00:18:00. Would imply final BTOs at quite low altitude and terminus very near 7th arc at sea level.
@paul smithson
The Boeing charts on fuel range and endurance carry a number of caveats:
1. Standard Day – what were the air temperatures en-route at the selected altitude.
2. No Wind – what if there was a strong tail wind or head wind.
3. 0.84 Mach step cruise – what if another speed mode or step profile was selected.
4. Typical Mission Rules – what if typical mission rules were ignored.
5. Normal Power Extraction – what if the electrical loads were atypical.
6. Normal Air Conditioning Bleed – what if there was another air packs setting.
@paul smithson
Here are my ideas for extending the fuel range:
1. Shortest air turn back after IGARI.
2. Always select the most fuel range efficient speed mode.
3. Always select the optimum fuel range efficient altitude.
4. Avoid any climbs except to enhance fuel range savings.
5. Avoid any unnecessary turns.
6. Execute turns in a fuel efficient manner.
7. Shortest FMT route with a single minimised turn.
8. No holding patterns or route deviations.
9. No INOP or APU usage.
10. Actively select route and altitude with highest tail winds.
11. Actively select route with optimum air temperature.
12. Select the most fuel efficient navigation mode.
13. Reduce all unnecessary electrical loads to minimum.
14. Switch off cabin heating, recirculation fans, galley loads, non essential avionics.
15. Switch off air conditioning packs and close ram air inlets.
16. Check the performance degradation allowance of each engine during flight.
17. Cross check the Fuel Quantity and Fuel Rate sensors during flight.
18. Pump fuel to opposite tank to maintain fuel balance.
19. Open cross feed valves at the optimum time later in the flight.
20. Ensure the aircraft is trimmed frequently during the flight.
PS – I still can’t say that I’m particularly enamoured with the putative explanations above but they are the best I can do right now. I’m hoping that there’s a better explanation that I haven’t thought of yet!
Richard – in relation to your 1-6 and 1-20 above.
Even with packs off, power draw minimal you don’t get further than 23:45
That’s a full ~30 mins short, equivalent to more than a couple of tonnes of fuel.
My estimates include the presumed temperature penalty.
With the exception of step climb, other “minor” fuel efficiency improvements are simply too small to bridge the deficit. The only way I can see an earlier step climb fit the BTO Arc4 and 5 is if the route “cut the corner” pre-FMT. That option is quite limited by BFO at 182815.
@paul smithson
I went through a similar exercise for Tom Kunkle, where his favoured crash point is 40.4°S 83.0°E.
I used 3 different methods to analyse the fuel range and endurance:
(1) The fuel model incorporated in the UGIB report.
(2) The Boeing Event Report fuel ranges and endurance in the Malaysian SIR.
(3) The Operational Flight Plan fuel ranges and endurance in the Malaysian RMP Report.
All 3 showed a short fall in fuel to reach 40.4°S 83.0°E.
Depending on your assumptions, there is much more fuel available than required for the UGIB last known point at 34.2°S.
Looking at the calculations again and taking all the assumptions in favour of extending the fuel range as far south as possible, I calculate a crash position of 39.4°S, but with strong head winds towards the end of flight with an ATW of ca. -34 knots.
Hi Richard, thanks for that. I have been focused on endurance associated with my path model assumptions rather than range. It may be possible to obtain greater range by throwing out certain of the assumptions inherent to the path fit (notably altitude) – but then the path solution is no longer valid.
I am still of the view something more than incremental assumption/model error is needed to bridge the gap: A step climb, extra accessible but unmetered fuel, idle descent, engine fuel exhaustion pre-00:17:30, or several of these in combination.
In my view, the case for this path solution is so compelling that it warrants serious consideration even if we cannot quite understand what combination of factors allow greater-than-assumed fuel endurance. I would like to “solve” the fuel problem in order to wrap it up and convince the sceptics, but have decided it’s best to proceed with getting the analysis published and leave others to scratch heads over fuel.
I can’t help the feeling there’s something we’ve all missed, related to either the path analysis or fuel analysis. In my view, the most compelling case would be a simple path that could be achieved with standard fuel management procedures.
@Andrew
One thing that has always bugged me, is that many flight paths have assumed LNAV waypoint navigation to various ultimate waypoints like the South Pole on 180°T or airfields in the Antarctica such as the Pegasus Field (NZPG) which services the McMurdo Station on 168.4°T.
The standard setting of the heading reference switch (HDG REF = NORM) normally references magnetic north for the avionic displays and computers (PFDs, NDs, AFDS, and FMCs) and automatically references true north when north of 82°N or south of 82°S latitude or within the vicinity of the magnetic poles.
What if there was no ultimate waypoint?
In this case the aircraft systems would revert to a Magnetic Heading after the last waypoint was overflown and a discontinuity mode was in operation.
@Richard,
Yes, when the aircraft overflies the last waypoint prior to a route discontinuity in LNAV, it maintains the current magnetic heading. LNAV remains engaged unless another lateral mode is selected.
@paul smithson
Nearly all of the fuel parameters interplay.
You are quite right to point out that you cannot ignore endurance to optimise range, or vice-versa.
You cannot switch off the cockpit heating to reduce the electrical load to optimise the fuel usage and then require an active pilot at the end of flight to open the cross feed valves.
Your hypothetical flight path warrants serious consideration, along with a number of others.
Yes, there are still a number of flight paths deserving conderation. What that says to me is that the anlaytics are not converging. What do you make of that?
@DennisW
In my view, we need to keep an open mind as there are a number of flight paths deserving consideration. There is only a sparse set of data available, there is still data that has not been released and not all assumptions have been fully tested. We may still be missing something significant in our analytics.
A historical review reveals a partial convergence of the analytics:
1. IG 37.7°S (26.09.2014).
2. Inmarsat 34.7°S (08.10.2014).
3. ATSB 32.8°S to 39.0°S (2014-2016).
4. DSTG 36.0°S to 39.3°S (03.12.2015).
5. CSIRO 31°S to 39°S (2016 to 2017).
6. UGIB 34.2°S ± 140 nm (08.03.2020).
7. Drift Analysis 34.1°S ± 65 nm (01.01.2021).
8. SDU Reboot at fuel exhaustion excludes POR Region, Christmas Island and Java (09.01.2021).
9. Fuel Analysis excludes southwards of 39.4°S (14.01.2021).
@DennisW. Nothing new with non-convergence! We have known from the outset that BTO and BFO optimisation solutions were divergent. Fuel analysis and drift analysis adds weight against the 34-35S region, but even the widened search there came up empty. Now, in extremis, the cherished “close to 7th arc assumption” is in jeopardy. I would advocate to set aside the hard fuel limitation assumption and look a bit further south where the BTO fit to a single turn solution is best. To be honest, I hate the idea of going further north. The BTO fit for straight path is lousy, so is BFO, it requires an extensive loiter between Arc1 and 2 and counter-indicated by drift. I also hate the idea of re-searching 34-35 or going wider still. So yes, at least one of the widely-held assumptions must be wrong and that has pretty much been the case from the start – only exacerbated by the unsuccessful search.
Yes, Paul, I am warming to your conclusion.
@Andrew
I agree we should be careful making assumptions about what the pilot did or did not know. Airline pilots are not generally aware of the specific location of radar sites along the routes they fly, particularly military sites. The pilot might not have known about the Sabang radar, let alone its operating hours.
However we do know that Zaharie Shah may have been well informed of regional military and radar defence capabilities, a sibling is a member of staff at the National Defence University of Malaysia.
Here is a simple standard normal (but not normal) flight path, inspired by a recent comment from @Andrew, a paper that I wrote together with @Don Thompson in 2016, looking again at the fuel exhaustion point with @paul smithson and @TBill’s new idea on Twitter from his investigation of Zaharie Shah’s home flight simulator:
– Simple Flight Path (Single FMT followed by LNAV to 3090S).
– Standard Fuel Management (LRC).
– Normal Heading Reference Magnetic North.
– Overflight of the last waypoint 3090S at 23:18:34 UTC followed by a route discontinuity in LNAV, maintaining the current magnetic heading of 210°M.
The flight path is a based on a single FMT at 18:38:41 UTC in LNAV mode following a Great Circle path to a waypoint of 30°S 90°E (3090S) in Long Range Cruise (LRC) speed mode. After the last waypoint is overflown the flight continues in Constant Magnetic Heading (CMH) navigation mode to a Last Known Position at 37.3°S 89.5°E.
https://www.dropbox.com/s/5b29gpf69knnh57/Flight%20Path%20LNAV%203090S%20CMH%20FL360%20FL400%20LRC.png?dl=0
I previously wrote a paper together with Don Thompson entitled “An Investigation of a MH370 Hybrid Flight Path”, which Duncan published on his web site dated 12th March 2016.
The paper is available for download in the Archive:
12th March 2016 – An Investigation of a MH370 Hybrid Flight Path (with Don Thompson) – Duncan Steel’s Blog.
or at the link below:
http://www.duncansteel.com/archives/2321
The essential idea of a Hybrid flight path model is based on the following linked-pair of assumptions:
(a) The B777 Flight Management System (FMS) was providing navigational instructions to the Autopilot Flight Director System (AFDS) via Lateral Navigation (LNAV) so as to fly the aircraft to a pilot-defined latitude/longitude waypoint in the SIO; and
(b) The Flight Management System (FMS) maintained the subsequent path (i.e. that taken after the overflight of the waypoint), in accord with the default reversion mode stipulated for a Route Discontinuity (according to the B777 Flight Crew Operations Manual, or FCOM).
When the FMS completes navigation to the final defined waypoint on any route it then enters the ‘Route Discontinuity’ state, but continues to provide guidance to the AFDS via LNAV. In Route Discontinuity mode the FMS guidance reverts to a simple magnetic (compass) vector as defined by the final heading of the previous leg (i.e. that maintained until the final defined waypoint was reached). That is, for the flight leg between the penultimate waypoint (in this case, likely near the FMT) and the final or ultimate waypoint the path flown would be a great circle (or geodesic); however, after passing the final waypoint the path flown is a loxodrome or rhumb line: a path with a constant bearing, with that bearing in this case being measured relative to Magnetic (rather than True) North.
@Richard. It’s ingenious to have fitted a “hybrid” path to the satellite data, but what is the point? 37.3S has been searched. Thoroughly. The plane ain’t there.
@paul smithson
No one is claiming that the underwater search had a 100% coverage.
The search width was originally ± 40 nm from the 7th Arc and later reduced to ± 25 nm based on the assumption that there was no active pilot at the end of flight.
With an active pilot, the theoretical distance flown from fuel exhaustion is 140 nm, which is well outside the area previously searched.
I think @Andrew is right, when he asks for a simple flight path and standard fuel management procedures.
I have shown a flight path with a single turn using the long range cruise speed mode. I have no way of knowing, whether there was an active pilot or not at the end of flight. The debris indicates that the crash caused the aircraft to break up on impact, but this does not automatically imply there was no active pilot. To limit the search width on the assumption that there was no active pilot is wrong, in my view.
Ok, then your path caveat is… that viability of this solution depends on the splash point occurring outside of the 77NM wide swathe of arc that has been searched at this location. At this latitude, there was quite extensive AUV search to cover data holidays in the deep-tow search. The likelihood of having missed wreckage within that 77NM swathe looks to me like a very long bet indeed.
Richard, I hope you can republish the flight path analysis, with Andrew and new co authors if possible, without the unnecessary early flight speculation and uncorroborated alleged witness sighting.
Good Luck
@BG370
I would like to write a new paper on the flight path analysis and would welcome new co-authors.
The authorities still have not divulged all the data they have and some data has been recently released under a freedom of information request in Australia, but not in Malaysia. There is always the hope that more data will be divulged or leaked.
Any new paper must test any assumptions made and show that each assumption is credible. Where there are alternative credible assumptions, then the alternative outcomes based on each assumption should be presented.
@Andrew has already signalled his willingness to provide operational and technical advice on the B777.
@airlandseaman has already expressed his interest, when we have substantive new information to work with.
Others are welcome to join in this effort.
@All,
I have run the Matlab scripts kindly provided by @Mike Eichhorn for 8 debris items in 8 different locations.
Mike’s scripts split the data sets, with 86,400 trials each, into two halves using 3 different methods:
(a) splitting the even and odd number trials (pseudo random check).
(b) splitting the small and large circles of trials (closer to or further from the 7th Arc).
(c) splitting the trials starting West of the 7th Arc from those starting East of the 7th Arc (inside to the West or outside to the East of the 7th Arc).
The idea is to see whether the results favour trials that originate closer or further away from the 7th Arc or inside to the West or outside to the East of the 7th Arc.
Below is a link to the summary for 8 debris items from 8 different locations.
34°S is still favoured as the crash latitude.
https://www.dropbox.com/s/yxqp7ynx5ir9v5m/Trial%20Split%20Results%20Summary.png?dl=0
Below is a link to the detail results (Excel) for the 8 debris items from the 8 different locations.
There is no discrimination between closer to and further from the 7th Arc. There is also no discrimination between inside to the West or outside to the East of the 7th Arc. In splitting the data the number of trials arriving within 20 km of a debris find location and within 20 days of the reporting time can be small. In some cases I extended the time window to allow a larger sample.
https://www.dropbox.com/s/5zg14xv7bv3273n/Trial%20Split%20Results.xlsx?dl=0
There is a wide range of results and the standard deviations are high, except for the Flaperon. The results again question the assumption that all generic debris transits are similar to undrogued drifters.
This bears out what David Griffin commented that the drift analysis shows only that 32°S to 39°S are possible crash latitudes. David Griffin also stated that the drift results using the new BRAN2020 data will most likely be substantially different to those to date.
Prof. Chari Pattiaratchi has always maintained that the crash site is between 28°S and 33°S , and that those latitudes should be searched wider from the arc.
@BG370
I sent Prof. Charitha Pattiaratchi (University of Western Australia) a copy of my drift paper on 2nd January 2021 asking if he would be kind enough to review and comment.
@All
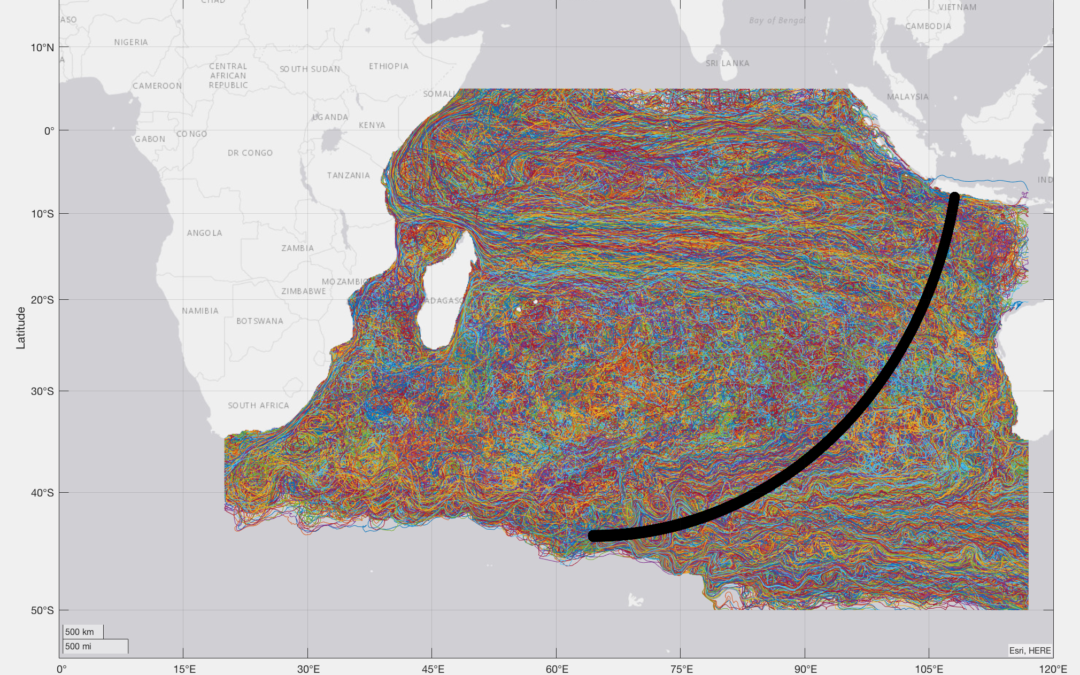
Here are links to .mp4 video files showing the Indian Ocean currents (CMEMS 24 hourly) and winds (CMEMS 6 hourly) as well as a .kmz file for Google Earth showing all the MH370 floating debris report locations, courtesy of @Mike Eichhorn. The video files are quite large, but reveal the dynamics of the Indian Ocean during the MH370 floating debris timeframe:
https://www.dropbox.com/s/oqadv2q0pzxy2mi/CMEMS_24HOURLY_032014-012017_u_v_0.49402%20m.mp4?dl=0
https://www.dropbox.com/s/i3lubet8yw0i60t/CMEMS_6HOURLY_WIND_032014-012017_u_v_wind_10%20m.mp4?dl=0
https://www.dropbox.com/s/7a59izb5kct8opc/Debis%20Observed%20Reports%20Overview.kmz?dl=0
Here is a link to a Google Earth graphic of all the MH370 floating debris locations:
https://www.dropbox.com/s/37husomvw83nxa9/Debis%20Observed%20Reports%20Overview.png?dl=0
@Richard, Mike Eichhorn. Graphic indeed.
I see bursts of westerly winds on SW Australian shores and imagine this would affect beaching probability. If there and more generally we knew how much, that might be integrable in probabilities and, where there were beachings, useful with how long there has been between beaching and finding.
The Leeuwin current does not seem to prevail as much as expected.
One can see how the currents between WA and Madagascar dither, though not the winds.
Looking at those dynamics of the winds and current around the Cape of Good Hope one can see also how a lot of the flotsam would end in the easterly current, that passing south of Australia and circling the world. Also I have the impression that were ‘Roy’ prone to getting airborne that could have reduced its prospects of getting west to Mossel Bay.
The third URL does not download on my machine.
@David
The third URL is .kmz file which dropbox does not preview, but it does allow a download. I have emailed you the file in any case.
@Richard. Thanks. Works
Off the wall comment (my specialty).
Using information theory compare searching an area already searched to searching an area that has not been searched.
Call P_m the probability that the wreckage was missed in an area searched ~ 0.1
Call P_f the probability that the wreckage is found in an area searched: ~0.9
Using info theory the information gained by researching:
H = -P_m*log(P_m)
H = -0.1*log(0.1) = 0.33 nats (natural log used). Base 2 log would yield bits.
In the case of a new area:
H= -(P_m*log(P_m) + P_f*log(P_f))
H = -(0.1*log(0.1) + 0.9*log(0.9)) = 0.47 nats
Ok, not a huge difference, but why not take 42% more information searching the same amount of area?
You get the same result using decision theory.
Sorry to be a boring nerd. It is a slow day.
@DennisW
You make your point well.
I am warming to searching wider as @paul smithson already noted.
The good news is the new OI technology can search faster and with a greater interactive intelligence in real time. OI can cover a wide area efficiently.
I also agree that the drift analysis is a blunt instrument, but nevertheless precludes north of 25S.
Drift analytics are valuable as a constraint, as you allude. I am leaning toward wider and farther South as the most promising areas to search. Searching areas already searched makes little sense to me.
I remain disturbed by our lack of pic motive and mindset.
@DennisW
If Ocean Infinity had not gone back to 45.9528°S 59.7739°W on 17th November 2018, where they had already searched on 13th September 2018 (day 5), they would never have found the Argentine Submarine ARA San Juan.
@All
David Griffin has kindly provided the data sets for the BRAN2020 ocean model.
Here are the results of a first test on the BRAN2020 data using 8 debris items from 8 different locations.
https://www.dropbox.com/s/gnvjmeksrc1yv5j/BRAN2020%20vs%20BRAN2015%20comparison.png?dl=0
Overall the same number of trials arrive within 20 km of the 8 debris find locations, with both BRAN2015 and BRAN2020.
BRAN2015 had an average of 522 trials arriving at each location within a distance window of 20 km.
BRAN2020 had an average of 520 trials arriving at each location within a distance window of 20 km.
It appears the major east-west transit paths in the Indian Ocean move a little further north with BRAN2020.
Debris find locations in Rodrigues, Mauritius and Northern Madagascar experience more arrivals.
Debris find locations in Reunion, Southern Madagascar, Mozambique and South Africa experience less arrivals.
I even tried out “Roy”, that beached in southern South Africa and for a distance window of 20 km, the number of trials arriving reduced from 17 to 6.
Interestingly the number of trials arriving in Tanzania also reduced from 1,021 to 911.
The number of trials arriving within the distance window of 20 km and the time window of 20 days generally reduces, with one exception, that of Mozambique.
The number of trials arriving within the distance window of 20 km and the time window of 50 days generally reduces, with one exception, that of Rodrigues.
Mauritius appears to be the pivotal point.
The mode crash latitude with BRAN2015 was 34°S.
The mode crash latitude with BRAN2020 was 37°S with a time window of 20 days and a reduced number of trials arriving within both the distance and time windows, but moves to 33°S with an increased time window of 50 days.
With BRAN2015 the mean crash latitude is 31.5°S with a time window of 28 days.
With BRAN2020 the mean crash latitude is 30.9°S with a time window of 20 days and 30.6°S with a time window of 50 days.
I still concur with David Griffin’s conclusion that the crash latitude is most likely between 31°S and 39°S.
@Richard. Drift of the part right outer flap that ended up in Tanzania has not been trialled, even by replica. Most likely its trailing edge stuck out of the water, which could well influence course and speed. Therefore I do not think its beaching position and timing can be used with any confidence in drift analysis.
Oddly though, in your comparison, that item, C23 has the most arrivals within 20km and the time window of all, even though with generous latitude standard deviations.
That is puzzling. Either it is by chance or is illustrative of how approximate the data can be, or both?
@David
OI searched from 36°S up to 25°S with a search width of around ± 25 nm.
Whether the crash latitude could have been north of 25°S hinges upon answering the following questions of awareness and reportability for both debris find locations and debris find timings:
1 (a). Were there in fact a large number of arrivals in Tanzania and Kenya (and Somalia), as expected from a crash latitude north of 25°S, but these were never reported?
or
1 (b). Were there in fact a small number of arrivals in Tanzania and Kenya (and Somalia), as expected from a crash latitude south of 25°S and two of these were reported?
2 (a). Were there in fact a large number of arrivals 5 to 8 months before the first report in Reunion was made, as expected from a crash latitude north of 25°S, but these were never reported?
or
2 (b). Were there in fact a large number of arrivals and Reunion was the first arrival and first report, as expected from a crash latitude south of 25°S?
@Richard. Thank you for posting these results. There illustrate the sensitivity of the inferred origin probability to the drift model that is employed. On top of that is the uncertainty regarding how representative the leeway factor is.
Even leaving aside these sensitivities, it is clear from the very scatted distributions both BRAN 2015, 2020 (standard deviation of origin latitude for each debris item) that this methodology is fundamentally imprecise.
My take home from this, I’m sorry to say, is that applying drift models to “pinpoint” the likely crash latitude is simply a bridge too far. I do not believe that it is of practical help in qualifying the search latitude.
@paul smithson
I would not call a crash latitude between 31°S and 39°S a “pinpoint”.
More like a constraint.