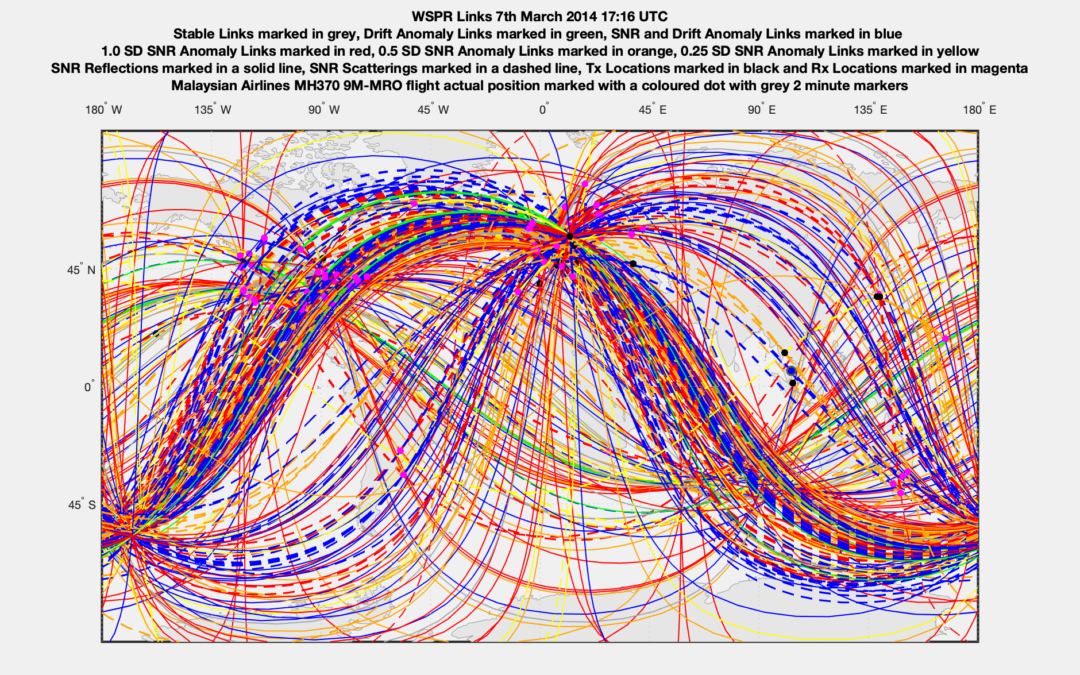
During the timeframe of the MH370 flight between 7th March 2014 16:00 TC and 8th March 2014 01:00 UTC there are 60,627 WSPR links over distances greater than 1,000 km, thanks to many dedicated radio amateurs world wide. There is an average of 224 WSPR links every two minutes over a total of 270 data points.
After 18:28:15 UTC there are only 7 Inmarsat satellite BTO values which allow a distance between the aircraft and the satellite positions to be measured. This is an average of one BTO value every 40 minutes over a total of 7 data points. There are two large gaps in the Inmarsat satellite BTO data of 72.8 minutes at the start of the trajectory into the Indian Ocean between 18:28:15 UTC and 19:41:03 UTC and 89.6 minutes towards the end of the trajectory over the Indian Ocean between 22:41:22 UTC and 00:11:00 UTC. In addition there is a gap of 10 minutes between the last ADS-B data before diversion at 17:20:35 UTC and the first civilian terminal area radar capture at Kota Bharu at 17:30:33 UTC.
It will be interesting to see what information can be gleaned from the 270 WSPR data points to help fill in the gaps we have in the MH370 flight path analysis. A paper describing the process of using WSPR to help find MH370 with a worked example can be downloaded here
Richard,
Concerning your “How Can WSPR Help Find MH370?” dated 11th October 2021.
In your paper you say: “Between 16:06 UTC and 22:06 UTC on the same day there was a total of 27 WSPRnet links
between these two stations with HB9CZF as transmitter and VK1CH as receiver.”
I had been going to ask if you would please provide an SNR vs Time plot to enable a visual comparison and analysis. However this has already been done.
From that visual representation there arise two specific questions:
1. Why did you select the time range 16:06 UTC to 22:06 UTC ?
2. Why did you choose to include the data point at 22:06 ?
From the attachment you will see that the data point at 22:06 would not seem to be a representative member of the set of data points around the time of 17:16 UTC, which is your time of interest.
As stated above, I had been going to ask if you would please provide an SNR vs Time plot. But, had I done that, I would have only asked for the SNR vs Time plot for the 27 data points that you used in your analysis.
In the attachment you will see that, instead, I have chosen a family of 32 data points from 14:46 through to 21:46 UTC.
I chose not to include the data point at 22:06 in my family of data points.
You may ask why I did not include the data points at 14:16 and 14:36 in my family. I chose not to.
Had I included those two additional data points, then that would not have changed my conclusion.
In fact, had I even included the data point at 22:06 then that would not have affected my conclusion.
AND,
had I only those 27 data points between 16:06 UTC and 22:06 UTC, then I still would have arrived at the same conclusion.
https://www.dropbox.com/s/809crsdsjp1p76p/Family.pdf?dl=0
@George, @Mike,
According to the Malaysian SIR, MH370 was cleared for take off on 7th March 2014 at 16:40:37 UTC and the last data received was via the Inmarsat satellite on 8th March 2014 at 00:19:37 UTC. We do not know the exact flying time of MH370.
We assume that take off was at 16:41:53 UTC. The Inmarsat satellite ACARS departure message marked as “OFF” was at 16:41 UTC and the Malaysian SIR reports take off at 16:42 UTC. Both data points are rounded.
The last Inmarsat satellite data at 00:19:37 UTC shows a significant descent but we do not know the altitude of MH370. A number of analysts have pointed out that it is possible that MH370 flew on after 00:19:37 UTC for quite some time and could have covered a distance of over 140 nm before crashing (please see the UGIB paper). The crash could have occurred as early as just after 00:20:00 UTC or as late as 00:48:00 UTC.
It is important to know the WSPR data before, during and after the flight in order to detect any difference in the WSPR signals with and without MH370. I decided to use a MH370 timeframe from 16:00 UTC to 01:00 UTC (as explained in my paper) to ensure a full coverage of the MH370 flight.
You ask: “1. Why did you select the time range 16:06 UTC to 22:06 UTC ?”
This is not a selection, this is all the available data in the specified MH370 timeframe. These times are simply because I was investigating the WSPR links between call sign HB9CZF and call sign VK1CH. These links only occurred between 16:06 UTC and 22:06 UTC. If there had been other signals in the MH370 timeframe between 16:00 UTC and 01:00 UTC I would have included them, but there were no such signals.
You ask: “2. Why did you choose to include the data point at 22:06 ?”
I included all the signals in the MH370 timeframe between 16:00 UTC just before the flight of MH370 to 01:00 UTC just after the flight of MH370. If I had excluded the data point at 22:06 UTC, then I might lay my self open to being accused of cherry picking.
One of the first things learned as a radio amateur is that there is a difference between ionospheric propagation during the day hours and the night hours. As I showed in my paper, the transmission by HB9CZF in Switzerland was made just at the point of dusk at 17:16 UTC and the entire propagation path to VK1CH in Australia took place in the grey zone or night hours. You decided to include WSPR signals from 06:00 UTC to 23:00 UTC in your comment, ignoring the actual timeframe of the MH370 flight and including day time signals which give a distorted picture. Your attached graphic is incorrect and misleading. Here is a corrected version:
https://www.dropbox.com/s/539oybo27s450b9/wsprspots-2014-03-07%201600%20to%200100%20VK1CH%20HB9CZF.png?dl=0
A longitudinal analysis of the SNR for the WSPR link between HB9CZF and VK1CH at 17:16 UTC each day between 1st March 2014 and 14th March 2014 (a week before and a week after MH370) shows that WSPR spots where only possible on 7th, 8th, 9th and 11th March 2014 at -20 dB, -22 dB, -21 dB and -19 dB respectively. In the MH370 timeframe, there were 27 signals, 23 signals, 30 signals and 25 signals respectively. On 10th and 12th March 2014 there were no links between HB9CZF and VK1CH at 17:16 UTC despite many other links at other times, totalling 31 signals and 32 signals respectively. Statistically it is important to consider both all the signals in the MH370 timeframe as well as the longitudinal variations at a particular time over a wider time frame.
Your inclusion of data points at other times is irrelevant and misleading. Unlike you I do not use WSPR links outside the MH370 timeframe between 06:00 UTC and 15:00 UTC. You appear to artificially construct a time frame which you call the “Family” starting at 14:46 UTC (a data point outside the MH370 timeframe) but on the other hand appear to want to exclude the data point at 22:06 UTC inside the MH370 timeframe. You give the impression that you are constructing an artificial MH370 timeframe to support your theory.
Meanwhile you ignore the body of the paper and give no explanation as to how it just so happens, time and time again (meanwhile 155 cases), that the Tx station, aircraft and Rx station are on the same great circle path when an anomaly occurs. In ignoring the facts that I present in my paper, you are unfortunately arriving at the wrong conclusion.
@Richard,
Did you choose to neglect my sentence: “had I only those 27 data points between 16:06 UTC and 22:06 UTC, then I still would have arrived at the same conclusion.”?
Reference to the attachment will clearly show that for the selected data you chose to use for your analysis the following apply:
1. The data point value of -20 dB at 17:16 is in no way anomalous.
2. It is merely a member of a family.
https://www.dropbox.com/s/xlbneuq4t6bfkpz/RICHARD%27s.pdf?dl=0
@George,
I have previously answered your comment in full. Your conclusion is wrong for the reasons given. Obviously you refuse to accept this fact.
You and your fellow detractors have nothing new to offer in the search for MH370. You resort to making disparaging remarks against my work based on cherry picking the data to suit your unscientific statements made out of questionable base motives.
I have presented in detail 155 cases of how WSPR can be used to help find MH370. They cannot all be wrong as you suggest.
You again ignore the key point of my work that the Tx station, aircraft and Rx station are on the same great circle path when an anomaly occurs. In ignoring the facts in the body of work that I present on my web site and in my various papers, you are unfortunately arriving at the wrong conclusion.
Richard,
“How Can WSPR Help Find MH370?”
In your “GDTAAA V4 MH370 07MAR2014 1716 UTC Paper” where you discuss and explain your methodology, you use the time 07MAR2014 1716 UTC as an example. You also use as an example a successful WSPR reception logged by an Australian receiver of a transmission from Switzerland which was logged as being at that time.
Of note, and as you point out, the aircraft 9M-MRO, conducting Flight MH370, was crossing the great circle path between the radio transmitter and receiver at that time.
In your paper you explain that due to the SNR value and its deviation from the mean you decided to investigate it further. “In this particular case I determined there was possibly a signal level disturbance” and “I decided to investigate the signal level disturbance further.” This is in Section “2. GDTAAA Output.” on Page 2 of your paper.
And then you proceed to discuss and explain further.
In your Section 5. Summary, you “conclude that it is possible that MH370 caused a disturbance in the signal
level”.
The attached report “SNR Data Review” concerns use of SNR data, where “SNR” denotes Signal to Noise ratio in radio reception.
The only SNR data to which reference is made in the report is data directly concerning your “GDTAAA V4 MH370 07MAR2014 1716 UTC Paper”.
This report is not intended to discuss any other aspect of that paper.
The only SNR data to which reference is made in the attached report is data directly concerning your paper.
One conclusion is apparent.
In recent times you have discussed consideration of whether or not an SNR differing from the mean by (say) 0.5, or even 0.25, Standard Deviations may be significant.
Based upon only the analysis of the SNR data associated with the example of your paper it would seem clear that an SNR differing from the mean by less than one (1) Standard Deviation would not be significant.
The Main Recommendation of the report “SNR Data Review” is:
“There is a perceived need for another follow-up similar paper for data for which there has been found to be a single clearly significant deviation from the mean for, or over, a time range or period of successful reception.”
https://www.dropbox.com/s/7wb63mzfhhfi1g2/SNR%20Data%20Review.pdf?dl=0
SNR Data Review v2
Page 10 affected
“The words “Standard Deviation from the Mean” added twice.
https://www.dropbox.com/s/21i1fzm8po56um5/SNR%20Data%20Review%20v2.pdf?dl=0
@George G,
I have previously answered your comment in full. Your conclusion continues to be wrong for the reasons given. Obviously you still refuse to accept this fact.
I have presented in detail 155 cases of how WSPR can be used to help find MH370. They cannot all be wrong as you suggest and pedantically insist. You decide to ignore all the other cases.
You claim to focus on the one case, that I used as a worked example, but have not looked at the 7th March 2014 17:16 UTC candidate WSPR link in any detail. You do not include any longitudinal study over a wider time period at the same time. You continue to cherry pick your timeframe to determine an artificial mean.
I consider a deviation of 41% as significant, you reduce it to a deviation of -0.08! I am considering absolute variation in the received power level across all values in the MH370 timeframe and in a longitudinal study over several weeks at the same time of day. You are comparing logarithmic values in dB using only an incomplete and selected part of the data and partial timeframe.
There are many more WSPR anomalies during the flight of MH370 which will be included in a full report in due course.
@Richard
Data Simplification, or Reduction, is a wonderful tool.
My failure to recognise that I had double pasted text into the Comment entry window before “pressing” the Submit “button was an error. That is unfortunate.
You are correct in that the raw data for the limited range 16:06 through 22:06 indicates that the deviation from the Mean for the data point at 17:16 represents a significant reduction in power from the mean received power over that time span, in the order of 40%. (You state 41%). The deviation from that mean is -2.3 dB, being -20 dB minus -17.7 dB, to the first decimal place.
You are correct in that data analysis and simplification, or reduction, has reduced the estimate of the deviation from a sensible mean of the complete set of data for the “day” to 0.08 Standard Deviations, specifically a deviation from the Mean of -0.08 Standard Deviation.
@George G,
We know from the official ADS-B data the position of MH370 close to flight route R208:
https://www.dropbox.com/s/8nr9g6vucmi4i47/GDTAAA%20V5%20MH370%2007MAR2014%201716%20UTC%20PRG%20Local%20View.png?dl=0
We also know that the position of MH370 is close to the great circle path between the WSPR Tx station HB9CZF and the Rx station VK1CH:
https://www.dropbox.com/s/mrkhcwuci9bnu48/GDTAAA%20V4%20MH370%2007MAR2014%201716%20UTC%20PRG%20Global%20View.png?dl=0
We also know that the position is close to the 3rd interim landing point for a ray propagation between HB9CZF and VK1CH at elevation angles between 1° and 3°:
https://www.dropbox.com/s/dejftrmipn6bnol/GDTAAA%20V4%20MH370%2007MAR2014%201716%20UTC%20PRG%20Hops%20EA%202.8942.png?dl=0
We also know that the WSPR protocol sent by HB9CZF was successfully decoded and enriched by VK1CH and captured in the WSPRnet database as spot id 186,123,049 with a SNR of -20 dB. The signal was sent with a Tx power of 30 dBm and frequency of 14.097079 MHz and after a propagation path of 17,248 km the Rx power would have been around -110 dBm.
We also know that at the same time 17:16 UTC the WSPR protocol was successfully decoded and enriched by VK3DXE as spot id 186,122,895 from the same Tx station also sent with a Tx power of 30 dBm and frequency of 14.097089 MHz with a SNR of -15 dB over a great circle path which was 130 km (0.8%) shorter, but on an azimuth that missed MH370.
@ Richard,
As per your inferred suggestion, and after some days of reflection, I have made a comparison of WSPR Reception by VK1CH and VK3DXE, both in South Eastern Australia, of HB9CZF transmitting from Switzerland during the afternoon/evening (UTC) of 2014-03-07.
Please find attached “raw data” comparison “V1vsV3raw”
https://www.dropbox.com/s/oe6u2qoba9a8qy8/V1vsV3raw.pdf?dl=0
Also please find attached “V1vsV3sSD” showing deviation from a straight line of first best fit for each.
https://www.dropbox.com/s/kp2nlnpy3hi1xf6/V1vsV3sSD.pdf?dl=0
.
..
@George G,
Many thanks for your continued interest in the WSPRnet signals transmitted by HB9CZF in Switzerland during the afternoon/evening (UTC) on 7th March 2014 and received by VK1CH and VK3DXE in the same Maidenhead Grid area QF in Australia. There are a large number of other WSPRnet indicators both along the flight path of MH370 as well as detecting other aircraft in the vicinity of MH370, which will require similar analysis.
My inferred suggestion was not concerning the SNR absolute values as received by both stations in the same area of Australia but the difference between the SNR values received as the azimuth of the propagation paths were similar, but the VK1CH path was close to the position of MH370 and the VK3DXE path not.
The SNR at the two stations follows a similar trend:
https://www.dropbox.com/s/6zoxc7pwmb55nm9/%20GDTAAA%20V5%20MH370%2007MAR2014%201716%20UTC%20SNR%20VK1CH%20vs%20VK3DXE.png?dl=0
At 17:16 UTC there is a difference in the SNR of 5 dB, which represents a power factor of 316%:
https://www.dropbox.com/s/vxy3810sg554ufv/%20GDTAAA%20V5%20MH370%2007MAR2014%201716%20UTC%20SNR%20VK1CH%20vs%20VK3DXE%20Delta.png?dl=0
This 5 dB does not appear to be an unduly large difference, which can range between +10 dB and -5 dB.
Including VK2MKD in the analysis shows that VK3DXE and VK2MKD follow more of a similar trend and VK1CH for some reason always shows a negative offset to the other two Rx stations.
@George G,
For completeness, here is the chart of the propagation paths from HB9CZF to VK1CH and VK3DXE.
https://www.dropbox.com/s/3e3wp7u8j3gtvih/GDTAAA%20V5%20MH370%2007MAR2014%201716%20UTC%20PRG%20Global%20View%20Rx%20VK1CH%20and%20VK3DXE.png?dl=0
@Richard,
Whilst reviewing the comparison between the two reception sets (VK1CH and VK3DXE) an error in the previous “V1vsV3raw” was found. The values for Mean and Standard Deviation displayed on that plot were in error for VK3DXE. Nothing else was affected.
So, attached replacement: “V1vsV3raw CORRECTED”
https://www.dropbox.com/s/rumb9s1aprn5lbe/V1vsV3raw%20CORRECTED.pdf?dl=0
The first and simplest data “analysis” is to look for a simple general trend. Fitting a straight line to the “raw” data can assist. (In other words: first best fit)
The second step may be to look for clearly unrepresentative data. For the two sets of data (V1&V3) the last vestiges of reception before it is totally lost “for the day” are not indicative of any general trend in the data, so may be removed on trial to see if more information can be gleaned from the data.
In the case of VK1CH and VK3DXE (V1&V3) removal of the final vestiges data does provide with a comparison as shown in attachment “V1vsV3raw_2nd”.
Your are questioning the difference between the two. Perhaps “V1vsV3raw_2nd” helps. It shows a general difference (once the scatter is “removed”) of approximately 4.5 dB as indicated by the difference in Means and the approximately parallel straight lines of (2nd) best fit.
https://www.dropbox.com/s/b6paw7gk1ugydmv/V1vsV3raw_2nd.pdf?dl=0
The associated “V1vsV3sSD_2nd” is also attached for the purpose of completeness.
https://www.dropbox.com/s/ag0whf2xy4wnxky/V1vsV3sSD_2nd.pdf?dl=0
@Richard,
Please find attachment: “V1vsV3raw CORRECTED”
Mean and Standard Deviation values displayed on the plot for VK3DXE are corrected.
https://www.dropbox.com/s/rumb9s1aprn5lbe/V1vsV3raw%20CORRECTED.pdf?dl=0
Please also find attachment: “V1vsV3raw_2VM”.
This is a trial of removal of the final extreme data points as radio reception is about to be lost due to ionospheric conditions.
It can be seen that for these two receivers alone there is a general difference of approximately 4.5 dB as indicated by the difference in Means in conjunction with the approximately parallel straight lines of best fit.
“V1vsV3raw_2VM” provides visual or graphic confirmation of the difference you discussed.
https://www.dropbox.com/s/oq7ubbqlxqrwmhy/V1vsV3raw_2VM.pdf?dl=0
.
@Richard,
You have written: “Including VK2MKD in the analysis shows that VK3DXE and VK2MKD follow more of a similar trend and VK1CH for some reason always shows a negative offset to the other two Rx stations.”
I do not over how long a period you have conducted your analysis. Simply based on what you have written I had suspected that it was just a difference between the VK1CH receiving station and the other two. Even perhaps there was a mountain in the way (or more in the way ?) in the direction of the transmission for reception by the Canberran receiving station.
So, I looked for VK2MKD reception on the 7th March 2014. I found only eight data points, the first at 20:06 hours UTC and the last two being trailing off of reception at 22:16 and 22:26, in a similar manner to how the other receptions trailed off before total loss of reception “for the day”. The other six data points might actually indicate that the reception by VK2MKD is slightly better than either of the other two receivers, even if at two times (20:36 and 20:46) the same SNR data values were recorded by VK2MKD as by VK3DXE.
For the remaining four data points available to me (20:06, 20:16, 21:06 and 21:46) reception of the transmission from HB9CZF was better for VK2MKD than VK3DXE by SNR differences in dB of 9, 5, 4 and 10 dB, respectively.
So, I guess when you wrote: “Including VK2MKD in the analysis shows that VK3DXE and VK2MKD follow more of a similar trend and VK1CH for some reason always shows a negative offset to the other two Rx stations.” your analysis was for and over a much longer time period than for which I have made a summary. My summary is in fact than the general scatter in data precludes many conclusions being made.
I do not over how long a period you have conducted your analysis.
Should have read:
I do not over know how long a period you have conducted your analysis.
I do not know for and over how long a time period you have conducted your analysis.
Apologies.
@George G,
Many thanks for your further analysis, corrections and apologies. There is no need to apologise.
You asked: “I do not know for and over how long a time period you have conducted your analysis.”
In my MH370 analysis, I look for candidate detections every two minutes in the timeframe between 7th March 2014 16:00 UTC (just before the flight) and 8th March 2014 01:00 UTC (just after the flight). I also check candidate detections longitudinally at the same time of day between 28th February 2014 and 21st April 2014.
Currently I am working on the analysis on average of 8 hours per day and 6 days per week. For each candidate detection, I run a number of checks using Proplab Pro V3.1 to check the Rx power level, elevation and length of the ionospheric propagation path, number of hops and interim landing points, proximity of a landing point at 36,000 feet to the actual or estimated position of MH370, possibility of reflection or scattering of the signal by MH370 and the possibility of the signal disturbance by other aircraft in the vicinity of the landing point.
Just after MH370 take off at 16:50 UTC there are a large number of other aircraft in the vicinity:
https://www.dropbox.com/s/dxh7swmckrymohq/GDTAAA%20V5%20MH370%2007MAR2014%201650%20UTC%20PRG%20Local%20View.png?dl=0
Later just after MH370 disappears from civilian radar at 18:00 UTC there are only a few other aircraft in the vicinity:
https://www.dropbox.com/s/vjf7nn6cwoa3ymm/GDTAAA%20V5%20MH370%2007MAR2014%201800%20UTC%20PRG%20Local%20View.png?dl=0
I do not set any time limit to the analysis of each candidate detection. I continue the analysis until I am satisfied that the candidate detection is significant or not. Only significant detections are included in the final flight track analysis.
At 17:16 UTC we know exactly where MH370 is from the official ADS-B data, so the candidate detection is a moot point and lacks practical significance.
During the diversion between 17:22 UTC and 17:30 UTC there are four significant candidate detections out of a total of five possible two minute WSPRnet detections. This allows the MH370 flight path during diversion to be defined with greater certainty:
https://www.dropbox.com/s/8140x1buanyemk8/GDTAAA%20V5%20MH370%2007MAR2014%201732%20UTC%20N%20Local%20View.png?dl=0
Following the last civilian radar data capture at 18:00 UTC, there are two alternative plausible flight paths to the 1st Arc at 18:28 UTC. One path includes the single military radar data point at 18:22 UTC and one path that does not. The path that does not fit the single military radar data point contains a much larger number of significant candidate WSPRnet detections.
There are also various alternative plausible flight paths between the 1st Arc at 18:28 UTC and the 2nd Arc at 19:42 UTC. The UGIB flight path has the lowest score in terms of the number of significant candidate WSPRnet detections.
You state: “My summary is in fact than (sic!) the general scatter in data precludes many conclusions being made.”
Please be clear as to which conclusions you accept and which conclusions you reject and why.
In answer to the question “How Can WSPR Help Find MH370?”, there are two key unanswered questions that WSPR data, taken in conjunction with other data, can help with.
The two key questions are: ‘Where?’ and ‘When?’
These two questions can be combined into the expression: “Where was 9M-MRO, at what time, on its final flight as MH370/MAS370?”
If, by clarifying the details of the last few minutes of the flight, the data can provide an accurate search region, this may be enough to justify a new ocean search. This will especially be the case if the search region differs from those areas already searched.
@TommyL,
In order to clarify the last few minutes of flight, it is necessary to know the flight path to that point in time and space (the when and where as you put it).
The puzzle has more than 100,000 pieces.
Ocean Infinity are willing to search again, the Malaysian Government has not yet made their decision public.
@Richard
1. In your comment of 28 October 2021 at 13:13 you state: “I do not set any time limit to the analysis of each candidate detection. I continue the analysis until I am satisfied that the candidate detection is significant or not.”.
And earlier in your comment you detail your time spent on task. There is no question as to your dedication and attendance to task.
2. My comment or question ““I do not know for and over how long a time period you have conducted your analysis.” was in specific reference to one sentence in your earlier comment of 27 October 2021 at 11:22.
2.1 In that comment you wrote: “Including VK2MKD in the analysis shows that VK3DXE and VK2MKD follow more of a similar trend and VK1CH for some reason always shows a negative offset to the other two Rx stations.”
2.2 My comment or question concerned the data time period. Specifically, how large (or long) a time period did you use to arrive at your observation: “Including VK2MKD in the analysis shows that VK3DXE and VK2MKD follow more of a similar trend and VK1CH for some reason always shows a negative offset to the other two Rx stations.” ?
2.3 In context, we had been discussing the reception of transmissions from HB9CZF in Switzerland by VK1CH in South Eastern Australia during the afternoon/evening (UTC) on 7th March 2014. Subsequently comparisons were being made between reception by VK1CH and by VK3DXE also in S.E.Australia.
2.4 The question is: Was your observation concerning the comparison between the three data sets, being VK1CH and VK3DXE, and additionally VK2MKD, based on the data available for the the afternoon/evening (UTC) on 7th March 2014, or was it based on much larger data sets for the three different receiving “stations” extending over a much longer sample data time period. ?
2.4.1 Perhaps it also included comparisons of the three receivers from transmissions by other senders ?
@Richard
3. Again refer to your comment of 28 October 2021 at 13:13.
You write: Please be clear as to which conclusions you accept and which conclusions you reject and why.
This was in response to my summary in comment of 28 October 2021 at 05:33, which read: “My summary is in fact than (sic!) the general scatter in data precludes many conclusions being made.”
4. Refer Report “SNR Data Review” (v2) dated 20th October 2021. This referenced data for Receiver VK1CH when receiving transmissions from from HB9CZF in Switzerland during the afternoon/evening (UTC) on 7th March 2014.
4.1 From the referenced data it was concluded:
4.1.1 There was “a trend beginning at the start of the successful transmissions.” and that “This trend is likely due to diurnal variations in the ionosphere. The trend is one of increased received signal strength, which may be likely as night time encroached on more and more of the path of transmission.” Note that “the start of the successful transmissions” actually refers to the effective start of successful receptions by the Australian receiver of the transmitted radio signal for the “day”.
And: “It is to be noted that at start of the successful transmissions the transmitter was still in daytime, but for most of the transmission path night had already fallen.”
4.2 Data for Receiver VK3DXE shows a similar trend at the start of successful transmissions.
4.3 Again with reference to “SNR Data Review”, for VK1CH following the first trend of increased received signal strength there was a decay in received signal strength followed by “another gradual increase in signal strength until daylight finally takes over at the receiving Australian station.”
4.4 Data for Receiver VK3DXE also shows the presence of a later gradual increase, perhaps less distinct.
4.5 For VK1CH there is a clear drop off at the last stage of reception. In fact: The second of the (only) “two deviations significantly greater than one Standard Deviation is the final vestigial reception before all reception is lost for the day.”
4.6 Data for Receiver VK3DXE also indicates a rapid drop off at the final stage of reception.
4.7 Available data for Receiver VK2MKD also indicates a rapid (even dramatic) drop off at the final stage of reception.
4.8 Refer attachment “V1vsV3raw_2VM” to my comment of 28 October 2021 at 00:33.
4.8.1. Statistically, VK2MKD reception (as measured by SNR) is generally 4.5 dB higher than reception by VK1CH, as indicated by the difference in means, after removal of the final extreme data points as radio reception is about to be lost due to ionospheric conditions.
@George G,
Many thanks for your detailed response to my questions. I am beginning to understand your problem.
You ask: “Specifically, how large (or long) a time period did you use to arrive at your observation: “Including VK2MKD in the analysis shows that VK3DXE and VK2MKD follow more of a similar trend and VK1CH for some reason always shows a negative offset to the other two Rx stations.” ?”.
In my MH370 analysis, I look for candidate detections every two minutes in the timeframe between 7th March 2014 16:00 UTC (just before the flight) and 8th March 2014 01:00 UTC (just after the flight). I also check candidate detections longitudinally at the same time of day between 28th February 2014 and 21st April 2014.
As far as the comparison between VK1CH, VK2MKD and VK3DXE is concerned there are data points with all 3 Rx stations in the MH370 timeframe only between 20:06 UTC and 21:06 UTC. I did not previously include the linked graphic because the timeframe is too limited to be meaningful:
https://www.dropbox.com/s/cpmdxcsrzqo3s73/GDTAAA%20V5%20MH370%2007MAR2014%201716%20UTC%20SNR%20VK1CH%20vs%20VK2MKD%20vs%20VK3DXE.png?dl=0
A longitudinal analysis of VK2MKD is also not helpful as there were not WSPRnet transmissions at the same time each day between 28th February 2014 and 21st April 2014. A comparison for those days in the week before to the week after the MH370 flight where data points are available reveals that 7th March 2014 was an outlier:
https://www.dropbox.com/s/8bepmpbp7atchzb/VK2MKD.png?dl=0
You conclude that because of “general scatter” of the SNR values that we should reject my worked example at 17:16 UTC.
I would suggest you do a longitudinal study between 28th February 2014 and 21st April 2014 including all Tx stations in Switzerland or at least in the JN47 Maidenhead Grid location and all Rx stations in S.E. Australia or at least in the QF21, QF44 or QF56 Maidenhead Grid locations. You may find that the fact the WSPRnet SNR data values are rounded to the nearest whole number precludes any precise conclusions, but such an analysis may support your “general scatter” conclusion.
However, in my view, you are missing the key points.
I only use SNR or Drift anomalies to make a list of candidate detections. This is not a final list of detections. Candidates are then subject to a more refined analysis using Proplab Pro V3.1.
The first check is whether MH370 is on the great circle path between Tx station and Rx station.
The second check is whether MH370 was close to an interim landing point in the hops between the ionosphere and the Earth’s surface and that most or all previous landing points were on calm water or flat ice or at least avoided rugged terrain.
The third check is whether any other aircraft was close to the propagation path and could have disturbed the signal.
I have meanwhile analysed 175 such candidates and I conclude that the WSPRnet data will be able to provide further detailed information about the flight path and crash site of MH370.
@Richard,
Re your comment of 30 October 2021 at 11:32.
Thank you for your background information and explanations.
Please refer to the attachment “1800 UTC”.
This shows two GDTAAA Plots.
The first is Figure 3 from your “Global Detection and Tracking of Aircraft in the Search for MH370” dated 1st May 2021.
The second is your “GDTAAA V5 MH370 07MAR2014 1800 UTC PRG Local View” which you attached here to your comment of 28 October 2021 at 13:13.
The significant development and refinement you have applied to GDTAAA in the five months since 1st May (Figure 3) and the second plot, as indicated by “V5” is noted. You are to be congratulated.
Refer to the attachment. I have highlighted seven Tx-Rx Links you have shown in the plots.
Three of these concern Figure 3. The first two are shown by Red lines and intersect close to the Red Dot at or close to the “Last Civilian Radar Point”. The third highlighted link is another separate Red line Link.
The other four highlighted Links concern the second plot.
The Link highlighted as “4” is a Blue Dashed line passing close to the Blue Dot indicating the actual position of MH370, 9M-MRO, at 1800 UTC.
Link “5” is an Orange Dashed line also passing close to the Blue Dot indicating the actual position of MH370, 9M-MRO, at 1800 UTC.
Link “6” is a separate Blue Dashed line.
Link “7” is a separate Red Dashed line.
Would you kindly please provide the Tx and Rx identification details for all seven of the highlighted links.
https://www.dropbox.com/s/t9k83vxo26mn2ea/1800%20UTC.pdf?dl=0
@All,
I am on schedule to complete my analysis of the MH370 flight path and crash point by the end of November 2021. From private emails and comments it appears that my readers fall into two camps:
1. One camp just wants to know what the WSPRnet data can contribute to refining a more precise crash point of MH370.
2. The second camp wants to understand all the nuts and bolts of how WSPRnet works in full technical detail and along the full length of the MH370 flight path.
I am therefore considering publishing two papers, one with the story line and one with the technical details.
My latest software version GDTAAA V5 has confirmed my earlier finding, that MH370 made several turns en-route (I have already published that finding in May 2021). In fact GDTAAA V5 is much better at picking up any turns, that were made during the flight. A good example is the diversion.
1. Diversion between 17:20 UTC and 17:32 UTC.
At 17:32 UTC the civilian terminal area radar in Kota Bharu picks up MH370 following the diversion back towards Malaysia. There were 4 out of a possible 5 WSPRnet detections during the turn back at 17:24 UTC, 17:26 UTC, 17:28 UTC and 17:30 UTC in the gap between the ADS-B data ceasing at 17:20 UTC and the radar capture at 17:32 UTC. When MH370 was flying straight and level after reaching cruise altitude, there were hardly any detections. Before the diversion there were 3 detections at 16:50 UTC, 17:02 UTC and 17:16 UTC.
https://www.dropbox.com/s/8140x1buanyemk8/GDTAAA%20V5%20MH370%2007MAR2014%201732%20UTC%20N%20Local%20View.png?dl=0
2. Hypoxia Case.
Assuming the diversion was because of a problem with the aircraft causing a loss of cabin pressure and hypoxia, then you would expect MH370 to carry on in a straight line without pilot control after the diversion. But after reaching Penang, MH370 makes a turn toward waypoint VAMPI according to the civilian terminal area radar for Penang area located at Butterworth AFB.
https://www.dropbox.com/s/0r6ndf3dtrdlwlj/GDTAAA%20V5%20MH370%2007MAR2014%201732%20UTC%20to%201828%20UTC%20Regional%20View%20Hypoxia%20Case.png?dl=0
3. Last Civilian Radar Point.
At 18:00 UTC the last civilian radar data point from Butterworth AFB shows the position of MH370 over the Malacca Strait heading toward waypoint VAMPI. The WSPRnet data shows a number of anomalies at 18:00 UTC both on the aircraft track as well as left, right and in front of the aircraft.
https://www.dropbox.com/s/vjf7nn6cwoa3ymm/GDTAAA%20V5%20MH370%2007MAR2014%201800%20UTC%20PRG%20Local%20View.png?dl=0
4. Official vs Alternative Flight Route.
The ‘official’ flight route of MH370 heads toward waypoint VAMPI and then follows flight route N571 to waypoints MEKAR and NILAM. At 18:12 UTC MH370 is approaching waypoint VAMPI and flight UAE343 from Kuala Lumpur to Dubai at FL 340 is just 3 mins 40 secs behind and slowly closing.
The ‘official’ flight route is supported by a number of ‘facts’, which all appear to be misleading:
4.1 The Malaysian Military radar presented a sighting of MH370 at 18:22:12 UTC on flight route N571 10 nm beyond waypoint MEKAR to the NOK in Beijing.
The data was never published in the official report and not used by the ATSB or DSTG in their analysis.
4.2 The ATSB claim MH370 did not approach a theoretical NW point at 19:12 UTC based on: “all radar sources (both mobile and stationary) were considered to define that point and what these sources were on a need to know basis.”
4.3 Kate Tee claimed a sighting of a large low flying aircraft close to the position of her sailing vessel in the Malacca Strait.
I have information from a reliable source that claim Kate Tee was not on watch that evening.
4.4 Indonesia announces that MH370 did not “cross over our territory”.
There were a number of other aircraft in the vicinity of MH370. Those heading towards the Middle East and Europe are heavily laden with fuel and are all initially assigned lower flight levels between FL300 and FL340. Those heading in the other direction towards Kuala Lumpur, Singapore and Jakarta are relatively empty of fuel and are all arriving at higher flight levels between FL370 and FL410. The skies over the Malacca Strait are relatively empty between FL340 and FL370.
MH370 was at FL350 prior to diversion and if FL360 was selected after diversion, then MH370 would not come in conflict with other traffic, even after switching the transponder off. UAE343 at FL340 followed MH370 at an assumed FL360 along the ‘official’ flight route for at least 24 minutes but did not report any sighting. If UAE343 had observed MH370 at FL350, then the pilot of UAE343 may have complained to ATC that another aircraft was within 15 minutes lateral separation, as MH370 was only 3 minutes 40 seconds in front on the same flight route with only 1,000 feet of vertical separation and not the usual 2,000 feet. If MH370 was at FL360, then there would have been adequate vertical separation.
https://www.dropbox.com/s/ucb99hmsetn1b00/GDTAAA%20V5%20MH370%2007MAR2014%201812%20UTC%20PRG%20Local%20View%20Official.png?dl=0
An alternative flight path for MH370 is shown below tracking toward the coast of Indonesia.
https://www.dropbox.com/s/bbl4p1dat18ljlo/GDTAAA%20V5%20MH370%2007MAR2014%201812%20UTC%20PRG%20Local%20View%20Alternative.png?dl=0
5. Inmarsat Satellite Data 1st Arc.
The ‘official’ route has MH370 performing a lateral offset to flight route N571 just after the reboot of the Satellite Data Unit on board MH370. Was this timing a coincidence?
https://www.dropbox.com/s/dtfws2qvghaj3b0/GDTAAA%20V5%20MH370%2007MAR2014%201828%20UTC%20PRG%20Local%20View%20Official.png?dl=0
An alternative flight route shows MH370 hugging the coastline of Sumatra. Such a flight route might be explained by a pilot suffering from the effects of hypoxia and disoriented or an aircraft with a failure of the navigation systems. It is common practice when navigation systems fail to find orientation by using landmarks within sight. A coastline with towns lit up on a moon less night provides a perfect means of orientation and following a coastline is easily accomplished using the heading selection control on the aircraft’s Mode Control Panel (MCP).
https://www.dropbox.com/s/e08t9hbtejnacb7/GDTAAA%20V5%20MH370%2007MAR2014%201828%20UTC%20PRG%20Local%20View%20Alternative.png?dl=0
6. 1st SATCOM Call.
The Inmarsat Satellite BFO data during the first SATCOM call at 18:39:55 UTC to 18:40:56 UTC shows a track in level flight of around 210°T. The implication for the ‘official’ flight route is that MH370 turned onto this track at some point shortly before the call came in. Was this timing another coincidence?
https://www.dropbox.com/s/l8e3x4rrp5z0ayt/GDTAAA%20V5%20MH370%2007MAR2014%201836%20UTC%20PRG%20Local%20View%20Official.png?dl=0
The alternative flight route in following the coastline around the tip of Sumatra is on a track of around 210°T without having to make any additional turn at a particular point in time. This alternative flight path is a natural fit and does not rely on any coincidences.
https://www.dropbox.com/s/36xlgcjt6go14ba/GDTAAA%20V5%20MH370%2007MAR2014%201836%20UTC%20PRG%20Local%20View%20Alternative.png?dl=0
7. Kate Tee Sighting.
The ‘official’ route passes close to the position of Kate Tee’s sailing vessel marked with a red dot in the chart linked below. Kate Tee places the timing of her sighting during a forced jibe of the sailing vessel in light and variable winds. The jibe takes place 30 minutes after MH370 has passed by according to the GPS records from the boat. Based on my analysis of the WSPRnet data and evidence from a reliable source, the sighting was fabricated.
https://www.dropbox.com/s/qp5ia1kctbmq0wg/GDTAAA%20V5%20MH370%2007MAR2014%201850%20UTC%20PRG%20Local%20View%20Official.png?dl=0
The WSPRnet data picks up MH370 in the alternative flight path continuing around Sumatra to the south side of the island.
https://www.dropbox.com/s/kktys1sn8zh7o4e/GDTAAA%20V5%20MH370%2007MAR2014%201850%20UTC%20PRG%20Local%20View%20Alternative.png?dl=0
8. WSPRnet data statistics.
The ‘official’ flight path between 18:00 UTC and 18:50 UTC has 8 WSPRnet detections, whereas the alternative flight path has 17 WSPRnet detections including 2 position indicators. Using a simple scoring technique the ‘official’ flight path scores 22 and the alternative flight path scores 56 as shown in the table linked below.
https://www.dropbox.com/s/1aotjmggragfne9/MH370%20Official%20vs%20Alternative%20Flight%20Path%20WSPRnet%20Detections.png?dl=0
9. Data Reliability.
There are over 200 books on MH370 and even more theories. We do not have all the available data on MH370. In particular the Malaysian Military have never released the radar data that they claim to possess, despite several attempts by the NOK at ministerial level. It is theoretically possible that the Beijing slide to the NOK showing a radar trace was fabricated. The flight route N571 is used all the time by aircraft flying between S.E. Asia and the Middle East or Europe.
Some conspiracy theorists claim the Inmarsat Satellite data was fabricated. I disagree and believe the Inmarsat Satellite data is reliable. Unfortunately the Inmarsat Satellite data does not give an aircraft’s absolute position (only a relative position and relative velocity). Unfortunately there are huge gaps in the data, especially the BTO data between 18:28 UTC and 19:41 UTC during the MH370 turn southwards into the Indian Ocean. There is second large gap in the BTO data between 22:41 UTC and 00:11 UTC at the end of the MH370 flight.
WSPRnet data in March 2014 was captured in real time and has not been modified since. Nobody even knew that the data might one day be used to track MH370, so it is quite safe and reliable.
“4.1 The Malaysian Military radar presented a sighting of MH370 at 18:22:12 UTC on flight route N571 10 nm beyond waypoint MEKAR to the NOK in Beijing.
>>The data was never published in the official report<< and not used by the ATSB or DSTG in their analysis."
Richard fyi I just happen to be searching for the word VAMPI in the SIR and Figure 1.1C is the only place the word VAMPI is found in the whole report, but the military radar is shown out to 1822, so it is explained clearly there and published by Malaysia. They do use a hedge word saying "it appeared to track…to N571"
When I get a chance I want to review how DSTG handled the radar data. Did DSTG allow for flight paths over Sumatra after 1801?
Looking at the DSTG Bayesian work, although the model does not have the 1822 radar point specifically as a requirement, the BFO reading at 1828 tells the model that the aircraft was continuing on a similar heading (along N571). So the paths over towards Sumatra are not favored by the DSTG model.
Dstg ran the model from 1802, not 1822
@Paul Smithson
DSTG ran their model from the penultimate 10 second radar data point before 18:01:49 UTC, in other words from 18:01:39 UTC.
“The radar data contains regular estimates of latitude, longitude and altitude at 10 second intervals from 16:42:27 to 18:01:49.”
“A prior was defined at 18:01 at the penultimate radar point”.
DSTG assumed the 1822 radar was good data, but without the 1825 SLOP maneuver, they could make the 1822 data fit exactly with the 1825-1828 data. So they allowed the model freedom to not go exactly through the 1822, but close. No way is DSTG or SIR suggesting a path does not go through approx VAMPI. I don’t think it is valid to imply a path that does not go near VAMPI is supported by SIR and DSTG. An investigator can propose that if he wants to, but it is not supported by SIR and DSTG.
@George G,
You asked: “Would you kindly please provide the Tx and Rx identification details for all seven of the highlighted links.”
Sure! They will all be in the second paper mentioned in the comment above.
@Richard,
Would you please consider providing ID of those seven Tx-Rx pairs in advance.
@George G,
I did consider it before I responded.
Please understand I am dealing with a large amount of data and am in the middle of an extensive structured systematic analysis.
I am not willing to break off from my current focus.
I am not willing to run a comparison between GDTAAA Version 1 and Version 5.
I am not willing to perform a deep dive into one point in time at 18:00 UTC, which is only one WSPRnet data point in time out of 270 data points.
Once I have finished the analysis and published the results, then we will have a much broader set of results to discuss along with all the backing data.
@All,
Sometimes you find something, when you are not even looking for it.
I previously reported that MH370 did not:
1. Fly past the Malaysian Military radar final data point in the Malacca Strait on flight route N571 around 10 nm beyond waypoint MEKAR.
2. Fly past Kate Tee’s sailing boat in the Malacca Strait during the transit on 7th March 2014 toward Phuket in Thailand.
3. Fly over the territory (land mass) of Indonesia.
4. Fly anywhere near the so called “Yellow Pin” or NW point as defined by the ATSB at 19:12 UTC.
But MH370 did fly around the coast of Sumatra in Indonesia, most likely without actually crossing the coast line and therefore passing over the territory of Indonesia:
https://www.dropbox.com/s/edrwtxee46l7ha0/GDTAAA%20V5%20MH370%2007MAR2014%201944%20UTC%20PRG%20WSPRnet%20Detections.png?dl=0
MH370 followed the coastline of Sumatra until 18:56 UTC and then turned South West:
https://www.dropbox.com/s/s4lgxe4dra31jsz/GDTAAA%20V5%20MH370%2007MAR2014%201856%20UTC%20PRG%20Local%20View.png?dl=0
What I found out, without looking for it, was that MH370 entered a race track holding pattern at around 19:12 UTC:
https://www.dropbox.com/s/ustwz4rl140fd0s/GDTAAA%20V5%20MH370%2007MAR2014%201914%20UTC%20PRG%20Local%20View.png?dl=0
I was surprised to discover that not only did MH370 enter a holding pattern, but that the holding pattern lasted for around 22 minutes until 19:34 UTC:
https://www.dropbox.com/s/zo9dejvy7cv0h6w/GDTAAA%20V5%20MH370%2007MAR2014%201934%20UTC%20PRG%20Local%20View.png?dl=0
This flight route of MH370 is a result of the WSPRnet analysis. The flight path is at a constant ground speed of 497 knots and a constant altitude of 36,000 feet. There is no contrived descent or ascent to match the Inmarsat satellite data. There are no contrived turns to match the Inmarsat satellite data timing or a fabricated sighting by Kate Tee. The Inmarsat satellite BTO and BFO data matches perfectly the timing, position and track at the 1st Arc (18:28 UTC BTO and BFO), during the SATCOM call (18:40 UTC, BFO only) and the 2nd Arc (19:41 UTC BTO and BFO). On entering the holding pattern MH370 was 150 nm from the coast of Sumatra and 40 nm from the 2nd Arc.
The holding pattern begs the question why? If the pilot’s goal was to make MH370 disappear without trace, then why waste fuel with a holding pattern and why not head directly to most remote area possible of the Indian Ocean without deviation?
At 19:44 UTC MH370 was 330.0 nm from the Indonesian military radar station at Sabang, 338.1 nm from Silboga and 347.1 nm from Lhokseumawe, comfortably out of all radar range. Neither the Malaysian nor the Indonesian Military have published any radar data.
There was only one detection of the Co-Pilots’s mobile phone near Penang. No other detections of any crew or passengers mobile phones were reported over Malaysia or Indonesia. The Malaysian authorities have not published the results of any investigation they may have made into the mobile phone connections of all the passengers.
The aircraft was 513.4 km from Kuala Lumpur and out of VHF range of Malaysia. The Line-Of-Sight VHF range at 36,000 feet for the 25 W transmission power of the Boeing 777-200ER radios in the VHF range 188 MHz to 137 MHz is 432 km. However, the aircraft was within range of the HF radio which operates using skywave transmissions just like WSPRnet in the HF range 2 MHz to 30 MHz. There is no record in the official report of any VHF or HF audio radio communications to or from MH370 after diversion. There are no reports of scanning the VHF or HF frequencies to check for any audio or data communications.
The holding pattern raises a number of possible questions:
1. Was the pilot in negotiation with the Malaysian Government?
2. Was the pilot waiting for a signal that the demands had been met?
3. Was the release of Anwar Ibrahim, the prominent Malaysian politician and former deputy Prime Minister, who was sentenced to 5 years imprisonment on 7th March 2014, amongst the demands made to the Malaysian Government?
4. Were the passengers and crew of MH370 held ransom by the pilot?
5. Were the passengers and crew still alive and held as pawns in a negotiation?
6. Did the negotiation go wrong?
Or was the pilot just checking that he was not being followed by using a holding pattern …
Or was the pilot just saying a final goodbye and taking one last breath before turning south into the Indian Ocean …
Or was the pilot continuing to act in a confused, indecisive and disoriented manner …
The analysis by Victor Iannello and Yves Guillaume of the Microsoft Flight simulator data found on Zaharie Shah’s extensive home flight computer set up is a smoking gun. Zaharie Shah simulated a single flight from Kuala Lumpur via the Malacca Strait to the point of fuel exhaustion in the southern Indian Ocean.
Professor Charitha Pattiaratchi says: “The only possible conclusion from an oceanographic and recovered debris perspective is that MH370 lies in the southern Indian Ocean.” A total of 33 pieces have been found by 16 unrelated people in six counties with most being identified as being from MH370 or a Boeing 777.
Extensive underwater searches in the Indian Ocean along the 7th Arc (as defined by the last Inmarsat satellite data connection) by ATSB and Ocean Infinity have so far not located the wreckage of MH370.
@TBill,
Many thanks for pointing out the mention of the military radar in Figure 1.1 C of the Malaysian SIR report.
“The primary target (military radar) appeared to track west-northwest direction joining RNAV route N571 at waypoint VAMPI thence to 10 nm north of MEKAR (source RMAF)”.
“The primary target ended at 10 nm after MEKAR at 1822:12 UTC [0222:12 MYT] (source RMAF)”.
As you say, it is strange that the word “appeared” is used. It is also less than helpful that the radar data from the quoted source of the RMAF was not included and has not been published since. The slide shown to the NOK in Beijing was also not included in the official Malaysian report.
The DSTG publication “Bayesian Methods in the Search for MH370” mentions a radar data point at 18:22:12 UTC but they decided no to use the data.
“The radar data contains regular estimates of latitude, longitude and altitude at 10 second intervals from 16:42:27 to 18:01:49. A single additional latitude and longitude position was reported at 18:22:12.”
This DSTG statement is in contradiction to the slide shown to the NOK in Beijing which shows a large number of purported radar data points between 18:01:49 UTC and 18:22:12 UTC.
“The 18:22 radar observation was not used quantitatively because the latitude and longitude derived from it are likely to be less accurate at long range and the aircraft may have manoeuvred prior to 18:22. The radar observation was deemed to indicate that the aircraft did not turn between 18:02 and 18:22, but the numerical values were not used. Instead, a prior was defined at 18:01 at the penultimate radar point”.
The DTSG also note a discrepancy between the radar data point at 18:22 UTC and the Inmarsat satellite data between 18:25 UTC and 18:28 UTC.
“Also, it was observed that the range ring derived from the timing measurements at 18:25 and 18:28 are closer to the 18:02 report than predictions based on either the 18:02 filtered speed or the 18:22 filtered speed.”
In the DSTG Figure 4.3 on page 20 shows the relative positions of the 18:25 arc and the Malaysian military track based on their radar data.
You ask: “Did DSTG allow for flight paths over Sumatra after 1801?”
DSTG state: “The radar observation was deemed to indicate that the aircraft did not turn between 18:02 and 18:22”.
Instead of using what “appeared” to be the track of MH370 and a single questionable radar point where it is “deemed” to indicate MH370 did not turn between 18:02 UTC and 18:22 UTC, the Malaysian authorities only need to release the full set of raw radar data points that was used in the slide presented to the NOK in Beijing.
@All,
Geoffrey Thomas has published two new stories on his web site at AirlineRatings.
1. Sensational New Finding for MH370 Flightpath – https://bit.ly/3F1Fya3
2. MH370 Holding Pattern Revelation – What Does It Mean? – https://bit.ly/3qkwkRW
@All,
The MH370 holding pattern is based around waypoint PAKRA, which is at the intersection of flight routes L896 and L774. Waypoint PAKRA is beyond radar range but within reach of a return to Kuala Lumpur or a number of other major airports in the region.
Was the pilot prepared to return to Kuala Lumpur if a negotiation was successful?
Following the holding pattern MH370 headed directly for the nearest point in the Australian air space. The point where the Colombo FIR, Jakarta FIR and the Melbourne FIR meet is at 2°S 92°E (known as 0292S).
Was the pilot considering a diversion to an airport in the Australian air space in the event that a negotiation was not successful?
The following link shows a regional view of the MH370 flight route:
https://www.dropbox.com/s/47x5bn1mvrijwld/GDTAAA%20V5%20MH370%2007MAR2014%202006%20UTC%20PRG%20WSPRnet%20Detections.png?dl=0
The next link gives a local view of MH370 reaching 0292S at 20:06 UTC:
https://www.dropbox.com/s/bmz5ejarhgbi9m9/GDTAAA%20V5%20MH370%2007MAR2014%202006%20UTC%20PRG%20Local%20View.png?dl=0
@All,
According to the Royal Malaysian Police report, Zaharie Shah logged in to his WeChat account at 16:40:12 UTC just before take off. This was not a phone call as has been reported in the media.
At 16:38:43 UTC Lumpur Tower told MH370 “Three Seven Zero line up Three Two Right Alfa One Zero”. Zaharie Shah logged into his WeChat account whilst lined up on runway 32R at Kuala Lumpur International Airport.
Zaharie Shah was checking his messages or possibly sending a very short message on WeChat. There was only 25 seconds between the WeChat login at 16:40:12 UTC and the message from Lumpur Tower at 16:40:37 UTC “Three Seven Zero Three Two Right clear for take-off good night.”
Unfortunately we do no know whether any messages were received or sent on WeChat or with whom Zaharie Shah may have communicated. WeChat uses end to end encryption and does not routinely archive all messages. We do know the WeChat contact list of Zaharie Shah, which comprised 47 entries including family, friends, MAS airline colleagues and his friend Fatima “Tim” Pardi. Tim Pardi is included 3 times in the contact list with 3 different addresses and 3 different mobile numbers (one mobile number terminated, one active DIGI network, one active CELCOM network). Tim Pardi used memes from Lara Croft and Hinata Sakura (fictive female warriors) and describes herself as a political activist for the opposition party in 2014.
@TBill,
You state: “DSTG assumed the 1822 radar was good data”.
That is nonsense! The DSTG rejected the 18:22 UTC radar data and used a prior at 18:01 UTC instead.
The DSTG state: “The 18:22 radar observation was not used quantitatively because the latitude and longitude derived from it are likely to be less accurate at long range and the aircraft may have manoeuvred prior to 18:22. The radar observation was deemed to indicate that the aircraft did not turn between 18:02 and 18:22, but the numerical values were not used. Instead, a prior was defined at 18:01 at the penultimate radar point”.
I do not think so…DSTG allowed 1825-1828 BTO/BFO to take some priority over 1822 radar, but the DSTG flight path goes past VAMPI to N571.
@TBill,
DSTG stated: “ The radar observation was deemed to indicate that the aircraft did not turn between 18:02 and 18:22”
We were all led astray with misinformation.
@Richard, could you report the BTO and BFO residuals associated with this latest path model, please?
Dear Mr. Godfrey,
I am very impressed by your findings and the big and successful engineering effort you put into GDTAAA.
May I ask the follow questions:
(1) Is GDTAAA also capable to detect and track vessels? At least big ones? Vesselfinder.com does what Flightradar24.com does for planes, and could be first source to test against.
(2) Is GDTAAA also capable to detect aircraft flying low over terrain or at almost sea level (usually called “below primary radar horizon”)? E. g. can you, e. g., plot planes starts and landings using GDTAAA?
(3) Do you consider it possible that the “22 minute lasting holding pattern” you have discovered could also have been a maneuver to either drop something at as distinct location for pickup (say a person or parts of the payload, e. g. to get later or at asap collected by a vessel, linking to question 1)?
(4) Do you consider it possible that the “22 minute lasting holding pattern” you have discovered could also have been a maneuver to substitute the 9M-MRO aircraft by a decoy aircraft for the SIO flight section, e. g. by a descent of the first one to “below primary radar horizon” (here: below GDTAAA coverage) when in the same moment climbing of a second one to “above primary radar horizon” (here: into GDTAAA coverage), linking to question 2?
(5) Around the north of Sumatra your GDTAAA findings vary a lot from the latest Victor Iannello Report. How would you explain these differences? See:
https://mh370.radiantphysics.com/wp-content/uploads/2020/03/image-11-1024×770.png
https://www.airlineratings.com/wp-content/uploads/uploads/Screenshot-344.png
(6) In March 2018, Martin Kristensen from Aarhus University, Denmark, concluded a flight path in direction of the Christmas Islands, claiming a support by debris, (underwater) acoustics and an eyewitness. Around Pulau Simeulue your GDTAAA findings almost match his path for a while. May this help support your theory? And does GDTAAA deliver an explanation for Kristensen’s path as you could finde for the Maldives Aircraft sighting (maybe another plane, maybe linking to question 4)?
Why am I asking. My approach to MH 370 is in constructing and probing theories of the criminal plot and its reasons the criminal act was executed for. Theories including someone or something on board the plane being of interest for someone (with power) would make more sense for planning and carefully executing such an extensive crime.
Thanks in advance for your thoughts.
Yours, Benjamin
@Paul Smithson,
You ask: “Richard, could you report the BTO and BFO residuals associated with this latest path model, please?”
As previously reported: “The Inmarsat satellite BTO and BFO data matches perfectly the timing, position and track at the 1st Arc (18:28 UTC BTO and BFO), during the SATCOM call (18:40 UTC, BFO only) and the 2nd Arc (19:41 UTC BTO and BFO).” The BTO and BFO residuals are both theoretically zero. Please note WSPRnet data uses the Maidenhead Grid locations and may be 18 nm in error and WSPRnet data is only available every two minutes.
The MH370 assumed altitude is 36,000 feet, rate of climb is zero, ground speed is 497 knots.
The WSPRnet data analysis at 18:28 UTC projected forward to 18:28:15 UTC results in a MH370 position of 5.977981°N 95.941737°E and a track of 296.0°T with a BTOR of 7.9415 µs and a BFOR of -0.2823 Hz.
The WSPRnet data analysis at 18:40 UTC results in a MH370 position of 4.897122°N 94.778332°E and a track of 210.0°T with a BFOR of -0.1092 Hz.
The WSPRnet data analysis at 19:40 UTC projected forward to 19:41:03 UTC results in a MH370 position of 0.970656°N 93.695278°E and a track of 213.3°T with a BTOR of -26.0775 µs and a BFOR of -1.7632 Hz.
@Benjamin,
(1) Is GDTAAA also capable to detect and track vessels? At least big ones? Vesselfinder.com does what Flightradar24.com does for planes, and could be first source to test against.
I have not tried to detect and track vessels yet. That would be an interesting test in the future.
(2) Is GDTAAA also capable to detect aircraft flying low over terrain or at almost sea level (usually called “below primary radar horizon”)? E. g. can you, e. g., plot planes starts and landings using GDTAAA?
Generally GDTAAA works best with aircraft at cruise altitude. It is possible to detect aircraft at low altitude such as helicopters and gliders but this appears to be not so reliable. Since GDTAAA uses ionospheric propagation, the line of sight horizon is irrelevant.
(3) Do you consider it possible that the “22 minute lasting holding pattern” you have discovered could also have been a maneuver to either drop something at as distinct location for pickup (say a person or parts of the payload, e. g. to get later or at asap collected by a vessel, linking to question 1)?
In the MH370 analysis I am constantly looking for other aircraft in the vicinity, including aircraft following or rendezvousing with MH370. I have used vessel tracking from BigOceanData but have not yet discovered any vessels in the vicinity of a drop point or the crash site of MH370.
(4) Do you consider it possible that the “22 minute lasting holding pattern” you have discovered could also have been a maneuver to substitute the 9M-MRO aircraft by a decoy aircraft for the SIO flight section, e. g. by a descent of the first one to “below primary radar horizon” (here: below GDTAAA coverage) when in the same moment climbing of a second one to “above primary radar horizon” (here: into GDTAAA coverage), linking to question 2?
Please see my answers to questions 1 – 3.
(5) Around the north of Sumatra your GDTAAA findings vary a lot from the latest Victor Iannello Report. How would you explain these differences? See:
https://mh370.radiantphysics.com/wp-content/uploads/2020/03/image-11-1024×770.png
https://www.airlineratings.com/wp-content/uploads/uploads/Screenshot-344.png
I was the author of both the charts you link. The publication of the first chart is dated 7th March 2020 and is taken from a paper I co-authored with Ulich, Iannello and Banks. It precedes GDTAAA and using WSPRnet data to find MH370. The publication of the second chart is dated 9th November 2021 and uses both the Inmarsat satellite data and the WSPRnet data.
I have previously explained that we were misled by:
(a) The Malaysian Military purported radar final data point in the Malacca Strait on flight route N571 around 10 nm beyond waypoint MEKAR, which has been questioned by the DSTG and for which no raw radar data has been provided.
(b) Kate Tee’s fabricated MH370 sighting from her sailing boat in the Malacca Strait during the transit on 7th March 2014 toward Phuket in Thailand, which has been refuted by reliable sources.
(c) The Indonesian Military claim that MH370 did not fly over the territory of Indonesia, which we took to mean MH370 did not fly over Indonesian territorial waters.
(d) The ATSB information that MH370 did not fly anywhere near the so called “Yellow Pin” or NW point as defined by the ATSB at 19:12 UTC, which we took to mean that the Singapore Air Force aircraft with an airborne radar system on patrol in the region that failed to detect MH370.
(6) In March 2018, Martin Kristensen from Aarhus University, Denmark, concluded a flight path in direction of the Christmas Islands, claiming a support by debris, (underwater) acoustics and an eyewitness. Around Pulau Simeulue your GDTAAA findings almost match his path for a while. May this help support your theory? And does GDTAAA deliver an explanation for Kristensen’s path as you could finde for the Maldives Aircraft sighting (maybe another plane, maybe linking to question 4)?
I have previously published a critique of the Kristensen paper. The BFO model is wrong, the satellite ephemeris is wrong, the Earth-Centred Earth-Fixed (ECEF) coordinate calculations are wrong, the aircraft performance model is wrong and the drift analysis is wrong.
The paper was debunked in the article below from 9th December 2018:
https://www.airlineratings.com/news/yet-theories-mh370-debunked/
Note: I am not the anonymous expert referred to in the AirlineRatings article.
Dear Mr. Godfrey,
many thanks for your answers.
Comparing the 22 minutes holding pattern to skyvetcor.com “World Hi” maps, one could conclude that it was executed in the nearest reachable region of such size, that is not diverted by any airway, as the surrounding airways an waypoints MABIX, P570, MERIM, L774, PAKRA, L896, NISOK and P756. So it might have been planned to do it there, as there they needn’t expect interference with other air traffic. Am I correct?
Yours, Benjamin
@Benjamin,
Certainly one issue for the pilot was avoiding other air traffic. The pilot avoided using busy air routes.
A holding pattern 150 nm off the coast of Sumatra and running parallel to the coast would be out of radar range and would not be seen as a threat to Indonesia.
If negotiations were taking place to release Anwar Ibrahim then MH370 could easily return to Kuala Lumpur to drop off the passengers in exchange for Anwar Ibrahim, refuel and fly to say Australia and seek political asylum. Possibly some of the crew would be kept as hostage until MH370 reached the safety of Australia or other neutral country willing to grant Anwar Ibrahim a safe haven.
@All,
Following the 22 minute holding pattern between 19:12 UTC and 19:34 UTC, MH370 headed for the nearest point in Australian air space. Four minutes after entering the Melbourne Flight Information Region (FIR) at 20:12 UTC, MH370 turned South-East on a track of 143°T toward Geraldton Airport (YGEL) in Australia.
https://www.dropbox.com/s/jhfgwv2dhy7ye6s/GDTAAA%20V5%20MH370%2007MAR2014%202012%20UTC%20PRG%20Local%20View.png?dl=0
MH370 continued on this track toward Geraldton, Australia for 20 minutes. At 20:32 UTC MH370 had flown 1,905 nm and had 2,099 nm fuel remaining plus a small reserve. The distance to Geraldton Airport was 2,038 nm and just within range.
https://www.dropbox.com/s/z8dqkyf8s78b8by/GDTAAA%20V5%20MH370%2007MAR2014%202032%20UTC%20PRG%20Local%20View.png?dl=0
Despite Geraldton Airport (YGEL) being within range, Learmonth Airport (YPLM) being closer, Cocos Island Airport (YPCC) and Christmas Island Airport (YPXM) both being even closer still, MH370 nevertheless turned due south on a track of 180°T at 20:32 UTC.
https://www.dropbox.com/s/um4mgan9cdbbksy/GDTAAA%20V5%20MH370%2007MAR2014%202046%20UTC%20PRG%20Local%20View.png?dl=0
A regional view showing the track towards Geraldton Airport (YGEL) up until 20:32 UTC and the turn due south is in the link below. The Emirates flight UAE425 was traversing the southern Indian Ocean from Perth, Australia to Dubai, United Arab Emirates at the same time.
https://www.dropbox.com/s/w5oigjdjs2lqyfc/GDTAAA%20V5%20MH370%2007MAR2014%202046%20UTC%20PRG%20WSPRnet%20Detections.png?dl=0
The fight route of MH370 following diversion appears to follow the plan:
1. 17:22 UTC: Divert back across Malaysia and head toward Indonesia.
2. 18:12 UTC: Circumnavigate Sumatra.
3. 19:12 UTC: Enter a holding pattern and prepare for a return to an Indonesian Airport.
4. 19:34 UTC: Leave the holding pattern and head to Australian air space.
5. 20:12 UTC: Head toward Geraldton Airport in Australia.
6. 20:32 UTC: Head due south to nowhere.
There appears to have been two key changes to plan, firstly to leave the Indonesian holding pattern at 19:34 UTC and head for Australian air space and secondly to head due south to nowhere at 20:32 UTC.
What prompted these changes of plan?
Was this evidence of a failed negotiation?
fascinating work.
i take it the WSPRnet track so far also corresponds to the arc handshakes
@David,
The track corresponds to the Inmarsat satellite BTO and BFO data exactly in all respects (timing, position, track, ground speed and ROC).
@All,
A new article by Geoffrey Thomas at AirlineRatings.com titled “Why did MH370 track towards Geraldton before turning due South to nowhere?”
https://www.airlineratings.com/news/mh370-track-towards-geraldton-turning-due-south-nowhere/
@Richard,
Richard, I would ask that you ask yourself one question:
“What is the statistical significance of a data point being within ONE Standard Deviation of the mean, or a mean, or some mean, of a set of data points ?”
The attachment “Less than ONE Standard Deviation” highlights “orange” and “yellow” dots you have used in your recent flight path analysis.
For clarity, the second attachment blanks out all of these and also your grey two minute markers so only more significant data points remain on the two plots I have chosen to use for my example and discussion.
There remains south of 1° South, One Blue Dot position marker, and there remain Four Red Dot position markers.
For Each of these you need to clearly demonstrate just how each of the five data points or position markers are derived from your analysis, and just how the five anomalies can be demonstrated to be anomalies.
https://www.dropbox.com/s/qsvajj7yiumv74e/Less%20than%20ONE%20Standard%20Deviation.pdf?dl=0
https://www.dropbox.com/s/d0ofip8abdzisyq/Any%20Semblance.pdf?dl=0
@George G,
As previously announced on 2 November 2021 at 11:23, I will be providing two papers.
Please see: “I am therefore considering publishing two papers, one with the story line and one with the technical details.”
I set out my approach in a post titled “Solving the Mystery of MH370” published on my web site on 4th January 2021, when I first started my web site.
“The mystery of MH370 has not yet been solved. The main crash location has not yet been found. The flight and cockpit voice recorders have not yet been recovered. Meanwhile there are numerous speculations and conspiracy theories. There are many different opinions, but there is no consensus. How does a modern aircraft disappear without trace?
Newton urged scientists never to speculate, only to prove by establishing experimental facts. Einstein urged scientists to speculate freely, since only daring speculations, not experimental facts, can advance science. Who, if either, is right? Maxwell argued in contrast to Newton that physical speculation is valid, but unlike Einstein gave reasons why the assumptions he made could be true. Mathematics can offer a proof, science can offer a hypothesis. We can demonstrate observations are consistent with our latest working hypothesis.
What we know about MH370 is much less than we do not know. We cannot proceed with our investigation very far, before we have to make assumptions. Based on those assumptions, we can conceptualise the data. We can formulate a hypothesis and deduce some results, which may fit the data or not. There are plenty of theories, but can they be tested and have they been tested? What if a theory cannot be tested? What if our assumptions are wrong? What standards do we apply to our theorising?
Speculation based on certain standards and constraints is valid. Developing an opinion, even in opposition to the accepted consensus, which may only be partial, temporally contingent, conflicting and uncertain is valid. Formulating a theory in order to explain or interpret the facts is useful. Establishing evidence based on objective and verifiable facts is essential. Corroboration of these facts from multiple reliable sources is convincing. Proof is evidence sufficient to claim that our conclusion is true. We have no proof of what happened to MH370 and why.”
At the moment I am making observations that are consistent with a working hypothesis. I am in the Maxwell camp, in between the Newton camp at one extreme and the Einstein camp at the other extreme. It is the reason why, I will produce two papers on the MH370 flight analysis:
1. The first paper will contain the result of the MH370 flight analysis without the technical stuff that does not interest some of my readers. It will contain the findings and a discussion of the findings with limited speculation.
2. The second paper will contain all the technical details behind the analysis, the method employed and the software used. It will contain all the backing data and a technical discussion, but no speculation.
It sounds to me that it is the second paper you want, a scientific paper without any speculation.
Many others just want to know X marks the spot, which they will get in the Executive Summary of both papers.
Yet others are interested in who and why, not just where and when. A limited and well founded speculation will be allowed in the discussion in the first paper.
Again I ask for your patience. There is a lot of work to do. There is no need to demand that I “clearly demonstrate” anything, since I have already said to you in a previous reply “once I have finished the analysis and published the results, then we will have a much broader set of results to discuss along with all the backing data.” Just to be clear, again I repeat I already plan to provide all the technical detail in the second paper.
I appreciate you have a completely different perception of WSPR than I do. I am not attacking your work, but you are attacking my work along with a few other detractors. Most people find this squabble childish and boring. I am open to a rational scientific discussion once my two papers have been presented. I am not willing to be dictated to, by you, on what I should “question” or “analyse” or “demonstrate” and when.
@All,
There was quite clearly an active pilot until at least 20:32 UTC. Flying a holding pattern and making considered changes of track would require an active pilot. More intriguing is the question, whether there was an active pilot until the end of the flight. I am constantly looking for any evidence of an active pilot.
At 20:32 the position of MH370 was 4.938523°S 93.412177°E. At 36,000 feet the air temperature was -46.4901°C. The aircraft weight was around 195.6 MT. For the Long Range Cruise (LRC) speed schedule the Mach would be 0.8404 and the True Air Speed (TAS) was 492.2 knots. The wind speed was 9.61 knots from 76.47°T. For a track of 143°T toward Geraldton Airport the Ground Speed would be 489.0 knots.
Changing the track to 180°T would normally result in a Ground Speed of 495.0 knots. The WSPRnet analysis shows a reduction in Ground Speed to 476.4 knots after the turn due south. A Ground Speed of 476.4 knots requires a reduction in Mach to 0.8085. The speed mode was changed from Long Range Cruise to Maximum Range Cruise (MRC) at the turn south. This also implies an active pilot. Selecting MRC also means the pilot wanted to go as far as the remaining fuel would allow.
The winds change quite significantly in speed and direction in the southern Indian Ocean in the latter part of the flight. This will give more clues as to whether LNAV with an ultimate waypoint, Constant True Track (CTT) or Constant True Heading (CTH) navigation mode was selected. The winds will also effect the fuel consumption, range and endurance.
Richard,
Thank you for the incredible amount of work you have put into analyzing the WSPR data to reconstruct the flight path of MH370. I am looking forward to the release of the two papers you are currently developing.
I was comparing the flight path shown in your comment above (8 November 2021 at 23:30; “GDTAAA V5 MH370 07MAR2014 1944 UTC PRG WSPRnet Detections.png”) with the path shown in your May 4, 2021, paper “MH370 Final Major Turn” for the one hour between 18:40 and 19:40. I would appreciate a discussion on why the May 4th analysis of the flight path missed the approximate 22-minute holding pattern. Perhaps the paper containing the technical details would be a good place for such a discussion. I realize that you appear to have made significant improvements to your software tools and workflow processes over the last six months, so this may be a big part of the explanation of the discrepancy between the flight paths for this one hour period reconstructed last May and last week.
Thank you for the consideration that you give to this request.
@Robert G.,
You are correct that the holding pattern was only discovered using GDTAA V5 and was missed using GDTAAA V1.
GDTAAA V5 contains many improvements based on the extensive testing using various aircraft, locations and timeframes. These test included blind tests as well as tests against known aircraft tracks.
I agree to your request to discuss why the holding pattern was previously missed in May 2021, but your assumption is correct that I have made significant improvements to the software tools and workflow processes over the last six months. This issue is appropriate for inclusion in the discussion section of the technical paper.
As Richard Godfrey’s stunning GDTAAA processing evolves, those new findings allow to uprise, within the spectrum of a blackmail scenario, the following new hypothesis for the two most extraordinary events (EE) throughout the whole MH 370 flight:
1st EE
The satellite data unit reboot at 18:25 UTC.
2nd EE
The inconceivable huge 4 hour long retardation in activating a search and rescue mission happening from 21:32 UTC onwards.
New Hypothetical Explainations:
1st EE
Up to now the only vague idea was leaving red crumbs after leaving radar coverage. But why? And this would have required the perpetrators to know from BFO/BTO that was no public available knowledge at this time. But in a blackmail, an active satellite phone connection mighthave been needed to report a sucessfull blackmail outcome from on ground perpetrators to the airborne perpetrators. Clever perpetrators would have avoided to allow the on ground blackmail victims (or the police) to speak directly to the airborne perpetrators for psychological reasons. For the optional incoming “on board victim release phone call” the perpetrators agreed on a specific time window and phone number to be the only one to be answered by the airborne perpetrators (or at least not to answer calls from e. g. the airline, as occured 18:39 UTC)
2nd EE
SAR mission started not before 21:32 UTC, oficially unspokenly blamed to unprofessional work on ground (airline, control centers of several countries). But if there might have been ongoing negotiations, this might explain the retardation as an intentional withholding.
@Benjamin,
The Malaysian Safety Investigation Report states that the Kuala Lumpur Area Control Centre (KL-ACC) should have communicated a Distress Phase at 18:27 UTC, which was at the latest 30 minutes after the Ho Chi Minh Area Control Centre (HCM-ACC) reported that they had not been able to establish radio contact with MH370, had lost secondary radar contact and an Uncertainty Phase was started.
Malaysian Airlines used the Flight Explorer system which predicted the position of MH370 from the Flight Plan. When the Duty Watch Supervisor at KL-ACC contacted Malaysian Airlines Operations Despatch Centre (MAS-ODC) just after 18:00 UTC when he was awaken in the rest area, the ODC responded that they would send an ACARS message to MH370 to tell the pilot to contact HCM-ACC urgently. The ACARS message was sent at 18:03:23 UTC.
The Duty Watch Supervisor was satisfied with the information from MAS-ODC regarding MH370 that the “aircraft (was) in Cambodian airspace” and returned to the rest area between 18:30 UTC and 21:30 UTC.
It appears more likely that this was a failure to recognise the urgency of the situation and follow the standard Uncertainty and Distress procedures in a timely manner, rather than a deliberate delay of four hours. The fact that Cambodian airspace was not on the flight plan appears to be an additional oversight.
@Richard
Thank you for reminding me to the official story, but I know it in detail, and my post was intended in starting questioning parts of the official story.
When your new findings are correct, then either the airline, the air traffic control centers of one or sebereal FIRs, or the military of one or several countries, or more then one of these bodies (or at least persons there with power), kept information from the public and/or fabricated information. At least for coverage reasons, but eventually even trough own criminal involvement.
Just remember the last data message that was withhold from the public until IG members claimed and had proof that there must have been one more. Just remember the role of the military, showing radar plots in Lido hotel, but not including those plots or the raw data into the report. This list goes on.
Me personal, I believe in on ground perpetrators in addition.
You want an idea? Let’s say for a moment, airline personell was involved in the crime or at least subject to a blackmail they tried to sort out (alone or with state/military help). It was the airline’s surprising ‘confidence’ in their system considering the plane still being airborne in Cambodian airspace. This kept air traffic control from starting their SAR procedures for hours. And seriously, it is hardly believable that they did not know it was a projection (if it was at all, this system was never released, nor?).
I am not blaming the airline. I just outline a hypothesis that is plausible to me.
@Benjamin,
I am on the record as requesting “the Malaysian Government to release the military radar data, raw RF data and any other information they may have in order to help solve the mystery of MH370.”
@All,
After Malaysia Airlines flight 370 disappeared in March 2014, the ICAO implemented new guidelines requiring aircraft to carry tracking devices to autonomously transmit location information in situations of distress.
Like other industries, aviation is being transformed by an information technology and communication revolution. Air traffic control (ATC) and flight operations centres (FOCs) are now exchanging large volumes of information with one another and with aircraft. Modern commercial aircraft (e.g., B787 and A350) generate up to 10 terabytes of data on each flight, which is exchanged with ATC, FOCs, and airframe/engine manufacturers—in addition to passengers accessing video streaming and other services. New entrants, such as Unmanned Aircraft Systems (UAS), are also dependent on robust links between the ground and the aircraft. These types of operations will account for an increasing share of air traffic and drive even faster growth in data exchange.
Global aviation is increasingly reliant on radio frequency (RF) spectrum and thus is increasingly vulnerable to degraded use caused by malevolent actors. As aircraft systems and ATC move away from traditional land-based navigation and surveillance systems to rely on space-based technologies such as GPS, the aviation ecosystem may become more vulnerable to purposeful interference. Given the centrality of the RF spectrum to aviation operations, the global aviation community must take steps to safeguard its use, including physical security measures as well as technical measures to prevent jamming and spoofing, to enable authentication, and to address other cybersecurity needs.
I was recently approached by the Mitre Corporation who have become world leaders in defence technology since their formation in 1958 in Bedford, Massachusetts, USA. Their customers are governments, military and intelligence communities in many countries around the world including Malaysia. The Mitre Corporation introduced a Common Vulnerability Enumerator (CVE) list in 1999, which is used by organisations from around the world and has become the de facto global standard for the exchange of cybersecurity information. They also work with partners such as Tecforte in Malaysia, an award-winning company with a successful track record in Cybersecurity Management and National Security.
The Mitre Corporation have read the recent reports on GDTAAA and using WSPRnet data to detect and track MH370 and point out, that if in addition to the WSPR data, raw RF data from the time of the disappearance is also available, then that could help solve the mystery of MH370.
One of Mitre’s products is called Photon, which enables the capture of raw RF data across the aviation bands. Photon can channelize, demodulate, convert to text, database and provide a searchable front end that provides keyword search resulting in the transcription, date, time, frequency and audio recording of the transmission.
If raw RF data was recorded on 7th/8th March 2014 including any VHF or HF radio communications at any frequency to or from MH370, then Photon would be able to convert the radio transmissions to plain text data. A request has already been made to release the raw military radar data available during the timeframe of the MH370 diversion and disappearance, I now also request the release of any raw RF data that may have been recorded at that time for intelligence purposes and which has not been included in the ATC transcriptions in the Malaysian Safety Investigation Report.
@Richard,
I dont pretend to understand WSPR or BTO/BFO or presume to critique your analysis of either. However I do know a little about following the advice of professional oceanographers and finding debris from Malaysian 370. I await the final results of your analysis with anticipation.
Search On !
@All,
There are a number of misconceptions about the WSPRnet data put out by various detractors in the internet. The Weak Signal Propagation Reporter Network is a group of amateur radio operators using K1JT’s MEPT_JT digital mode to probe radio frequency propagation conditions using very low power (QRP/QRPp) transmissions. The software is open source, and the data collected are available to the public through their web site at: https://www.wsprnet.org/drupal/
Documentation and software downloads of WSPR programs and other WSJT-related modes of Joe Taylor, K1JT, are available from the WSJT web site. The entire database of millions of WSPR spots is available for public download in comma-separated value (CSV) format compressed with the gzip and zip utilities. Each file contains the data for one calendar month of spots. The data begins with the initial release of WSPR in March, 2008. The file for the current month is updated automatically once per day in the early morning UTC, and the monthly historical files are regenerated once every month.
Live primary WSPR KiwiSDR data (waterfall) is available at http://www.kiwisdr.com
Another helpful resource is at https://wspr.live
Evaluating the primary raw data shows that there is a wide range of Doppler variations and amplitude. Some detractors are only evaluating the secondary WSPR data and miss the wide range of WSPR Doppler variations and amplitude fluctuations. In fact sometimes more than 50% of the WSPR signals will not be decoded due to this reason and never make it to the archived database. @RobW has done a lot of research using the WSPR raw data and recommends looking at the primary data to get a better understanding of the technology.
Others make the mistake of comparing the signals from an HF Flex Radio to WSPR and try and compare signals with less than 1 second integration time to WSPR signals with 2 minutes integration time.
I have asked @RobW to publish some of his research findings when he is ready. Both our research into using WSPR technology to detect and track aircraft is a work in progress. We are not claiming to have all the answers. Meanwhile detractors would do well to maintain an open mind and not mix up their apples with their oranges.
@All,
The MH370 flight path was due south from 20:32 UTC until 21:54 UTC.
The speed was aligned initially to the Long Range Cruise (LRC), then later to the Maximum Range Cruise (MRC) autothrottle speed schedule and then even later back to LRC.
https://www.dropbox.com/s/ssmv17m2gi6crjw/GDTAAA%20V5%20MH370%2007MAR2014%202154%20UTC%20POS%20Local%20View.png?dl=0
At 21:54 UTC MH370 turned South East on to track 163.3 °T.
At the same time MH370 accelerated to the maximum cruise speed at FL360 at Mach 0.866 and a Ground Speed of 505.8 knots.
This is again evidence of an active pilot.
A continuation along this track with an initial bearing of 163.3 °T would lead you eventually very close to the Zaharie Shah Home Flight Simulator end point of 45.0852°S 104.1455°E.
https://www.dropbox.com/s/dai1xe5cqk0m4mo/GDTAAA%20V5%20MH370%2007MAR2014%202208%20UTC%20POS%20Local%20View.png?dl=0
At 22:26 UTC MH370 turned South West again on to a track of 213.8°T.
By pure coincidence MH370 tracks South West parallel to the 5th Arc with a small offset.
The position of MH370 at 22:41:22 UTC exactly matches the Inmarsat Satellite BTO and BFO data.
https://www.dropbox.com/s/4g81d5bvevjy532/GDTAAA%20V5%20MH370%2007MAR2014%202228%20UTC%20POS%20Local%20View.png?dl=0
ATSB, DSTG, Inmarsat, Boeing, IG and just about every other analyst assumed that MH370 flew in a straight line due south.
In fact MH370 was in a zig zag pattern which just so happened to fit a straight line south, when one used the Inmarsat Satellite data at around every hour.
It was a simple problem of having too few data points to know what was happening in between the Inmarsat Satellite data points every hour.
https://www.dropbox.com/s/coryzvgl22hbc9f/GDTAAA%20V5%20MH370%2007MAR2014%202242%20UTC%20PRG%20Local%20View.png?dl=0
@All,
Geoffrey Thomas at AirlineRatings.com has released another article on MH370 titled “MH370 Pilot Zigzagged as he flew into the Southern Indian Ocean”:
https://www.airlineratings.com/news/mh370-pilot-zigzagged-flew-southern-indian-ocean/
Hello Mr. Godfrey
what do you think is the probability for so many coincidences, flying a completely different first turn at IGARI, flying a completely different track in Indonesian airspace, flying a holding pattern south of Sumatra, flying a straight course towards Geraldton, flying straight south, flying a ziczac and nevertheless fitting with the Inmarsat pings and probably ending up in the same area around 34.5 degree?
Zero probably in my view, sorry for that!
During the last seven years I liked your posts at Victor‘s Blog a lot but this time I have my doubts about your theory. Anyway I hope you prove us wrong and MH370 will be found with the help of your idea.
Best regards
D.Roller
@Dieter Roller,
Welcome to the blog!
According to the Aviation Safety Network’s Aircraft Accident database in the last 50 years a total of 50 aircraft including MH370 have been reported missing without trace. That is one aircraft on average every year.
In 2014 there were 33M commercial aircraft movements registered by the ICAO. There were 239 passengers and crew on MH370 out of a total of 3.3B passengers carried by the 33M commercial aircraft.
The chances of MH370 going missing without trace in 2014 are 1 in 33M.
The chances of being a passenger on MH370 on 7th March 2014 when the aircraft went missing are 227 in 3.3B or 1 in 14.5M.
The chances of the missing MH370 having been diverted and following the flight route I have described with an exact fit to the ADS-B, ACARS, Civilian Terminal Area Radar (TAR), Inmarsat and WSPR data is 100%. In addition 33 items of debris have been found in the Indian Ocean and Oceanographers have analysed the drift data to the locations where items have been found. This is a data driven exercise, not a game of chance.
Since I have not yet announced the MH370 end point based on my current WSPRnet based flight analysis, you are making an assumption that the aircraft was “probably ending up in the same area around 34.5 degree” south.
Many thanks for the well wishes “I hope you prove us wrong and MH370 will be found with the help of your idea.”
The truth can’t be proven wrong no matter how hard anyone tries.
The endpoint on his flight sim surely must have been a guide for confidence of going beyond the intended resting place and not giving an exact intended endpoint to help find the aircraft.
The heading changes used for a guide using distant airports and major beacons, there would be no ILS for this landing. The zig-zagging, speed and altitude changes make sense if real time tweaks towards a resting place in the deepest most challenging part of the Ocean floor.
A game was played for whatever reason, those gamers who played Falcon (going undetected), Flight Sim (flights to empty places) and the original arcade game Moon Lander (tweaking real time for landind without aids) would understand. It’s a pattern that makes sense for someone playing a game.
And sadly I think the last location you find (and great job so far) will likely be the ideal place not to be found in that part of the Ocean.
@David Burns,
Welcome to the blog!
The zig zag path does not consist of small “real time tweaks” towards a single end point.
The track changes around Sumatra follow the coast off shore.
The track change South West is to a point 150 nm off shore from Sumatra to a holding pattern. This was a single race track holding pattern.
The track change after the holding pattern is to a particular point at 2°S 92°E, where the FIR of Melbourne, Jakarta and Colombo meet. This was the nearest point of Australian air space.
The next track change is toward a particular point of Geraldton Airport, Australia.
The next track change is due south on 180° True.
The next track change is toward the final Zaharie Shah home flight simulator end point at 45.0852°S 104.1455°E.
The next track change is South West to nowhere in particular.
The next track change is due magnetic south on 180° Magnetic.
I conclude the various track changes were an attempt to cover up the flight path taken and make it difficult to find MH370.
@Tom,
Many thanks for your kind words of support.
@All,
At 22:46 UTC MH370 turned again onto a track of 172. 987°T (180.000°M as of 7th March 2014). The ground speed slowed to 460.9 knots which at an aircraft weight of 182.3 MT aligns with a Maximum Range Cruise (MRC) speed schedule at Mach 0.78. There was a 6.0 knot tailwind. At 23:00 UTC there was a small course correction to 175.0°T and the ground speed increased to 490.5 knots and Mach 0.84 by 23:08 UTC.
At 23:08 UTC at FL360 and an aircraft weight of 180.2 MT MRC would be 0.774 and LRC would be 0.810, so neither of these speed schedules were selected. Instead Mach 0.84 was selected, which is full cruising speed. There was a tailwind of 8.6 knots and a cross wind of 55.3 knots. The wind speed was 56.0 knots from 273.8°T. The fuel remaining was estimated at 5,814 kg.
https://www.dropbox.com/s/5h294dw71otzzwe/GDTAAA%20V5%20MH370%2007MAR2014%202246%20UTC%20POS%20Local%20View.png?dl=0
https://www.dropbox.com/s/rvsxs4dcyuirq36/GDTAAA%20V5%20MH370%2007MAR2014%202300%20UTC%20POS%20Local%20View.png?dl=0
https://www.dropbox.com/s/3zljnsqf44g9nf0/GDTAAA%20V5%20MH370%2007MAR2014%202308%20UTC%20PRG%20Local%20View.png?dl=0
The MH370 flight path up until this point is summarised in the following link:
https://www.dropbox.com/s/wj5rcf3iobf5t5b/GDTAAA%20V5%20MH370%2007MAR2014%202308%20UTC%20PRG%20Regional%20View.png?dl=0
The WSPRnet detections are marked in the following link:
https://www.dropbox.com/s/j0s9hit05hjyzc5/GDTAAA%20V5%20MH370%2007MAR2014%202308%20UTC%20PRG%20Regional%20WSPR%20Markers%20View.png?dl=0