New MH370 breakthrough tracking technology passes another validation test.
I have used an MH370 search aircraft from the Royal New Zealand Air Force on March 28th, 2014 to help validate this new technology called GDTAAA (Global Detection and Tracking of Aircraft Anywhere Anytime).
This new system is based on the Weak Signal Propagation Reports (WSPR) pronounced ‘whisper’ and promises to give a new search for MH370 a more precise location of the Boeing 777. This new analysis aligns with the satellite and drift modelling that points to an end point of MH370 at around 34.5°S near the 7th Arc.
This validation report is one of many planned to build a compelling body of work before the final analysis of the MH370 impact zone.
The report can be downloaded here
@Richard
An interesting piece of work, Richard. A few questions please.
Do you have the verified actual flight path for that RNZAF flight or are you just inferring it from other sources?
Relatedly, what is the track bearing for the long leg of the search pattern being flown?
Can you provide the Tx and Rx station details for the various anomalies used to plot the detections?
Many thanks.
@Richard. Thank you for this progress paper. Under some pressure, nicely done.
You will be aware of Geoffrey Thomas’s reporting of it:
https://www.airlineratings.com/news/new-mh370-breakthrough-tracking-technology-passes-rigorous-valiadtion-test/
Addressing one theme, as to whether a flaperon was spotted on this flight, I attach a CSIRO drift analysis, post genuine-flaperon trials. That suggests it would not have been.
https://www.dropbox.com/s/cmsxkxlyhldsf60/Location%20of%20possible%20flaperon%20with%20surface%20searches.jpg?dl=0
Of course the above would not cover possibilities from a piloted glide.
I assume that the above specific drift analysis was covered by the CSIRO’s drift report part IV in its page 6 ‘Conclusion’ about like analyses. There it was stated, “It is conceivable that some hypothetical debris fields could have escaped detection by not dispersing very much, and remaining by chance outside the detection range of every overflight but the chance of this would appear to be very small.”:
(https://www.atsb.gov.au/media/5773567/mh370_ocean_driftiv_oct2017.pdf.)
(This has not been re-run to my knowledge using the up-to-date BRAN20, though I suspect that would not make sufficient difference to alter that general outcome.)
I note that from Bernard Lagan’s accounts it is quite clear that the ‘panel’ appeared blue. Others (such as RAAF) possibly described it as light blue. I do not think a light grey flaperon, would appear blue or even light blue when awash and with its broken trailing edge exposed. There is also no sign that there was any such exposure or that there was trailing edge missing, though it could have been from the left wing and intact. Even so I would expect the trailing edge to project and be awash. Besides in both cases i would expect one end to be lower.
Also from the non-close up photo of it, it looks small compared to the seas and occasional wash.
Still, if there remains a reasonable case I could seek any AMSA record of any outcome of any Haixun 01 investigation. While the area was marked by a “tracker beacon” and smoke float for homing these might not have lasted.
That all aside, some bits you may be able to throw some light on; though not now if that will impede your progress unduly:
• The screen shot at the top of page3 is indicative rather than of this day’s search? (e.g. its time would have it on the way home).
• Going to the bottom of your page 6, there are numerous places where anomalies intersect. There are also a couple of blue-on-blues. Considering all these, on this and other pages, how do you know that one on the track is not just coincidence?
• The turn at the end of the first search leg is characterised not just by the anomalies increase that you have explained but by the same with stables. Their density increase can be explained?
• As to why would there be no position indicator during the turn, that would be because aircraft bank does not encourage anomalies along the fore and aft axis? Yet there are the vortices still….
• The earlier 360˚ turn at the ‘flaperon’, while of a similar radius, was not accompanied by such a concentration of progress indicators or any stables I note. A quirk of the conditions?
• I note the aircraft did not turn or divert for inspection of other sightings on this leg so I assume they were of low interest or none was encountered on it.
• The outcome has the potential to help discriminate the probabilities between postulated tracks, though no anomalies or positions detected on a postulated track does not mean rule out that track? Likewise, as you illustrate at the bottom of page 14 bottom a position indicator does not mean of course that there was an aircraft there.
One other observation in passing. From the EXIF data on the (possible) flaperon photograph, page 6, the aircraft was at 184m below sea level when that was taken. That does not seem likely, even though they were from New Zealand.
@All
I have written the following request to Peter Foley at the ATSB:
Peter,
I am continuing my MH370 analysis using the Inmarsat satellite data, CSIRO David Griffin’s BRAN2020 drift simulation data and more recently the WSPRnet radio transmission aircraft scatter data.
I have developed a Global Detection and Tracking for any Aircraft Anywhere Anytime (GDTAAA) based on the WSPRnet radio transmission aircraft scatter data.
I have recently published a report of a GDTAAA validation test using the AMSA search flight conducted by RNZAF Orion P-3C aircraft (NZ4204 ICAO:C87F0A) of 5 Squadron during its flight on 28th March 2014 from Pearce AFB, Australia to the search area for MH370 in the Indian Ocean:
https://www.dropbox.com/s/u34r5og6y5q5swv/When%20Do%20Whispers%20Shout.pdf?dl=0
Geoffrey Thomas has published an article on this validation test.
https://www.airlineratings.com/news/new-mh370-breakthrough-tracking-technology-passes-rigorous-valiadtion-test/
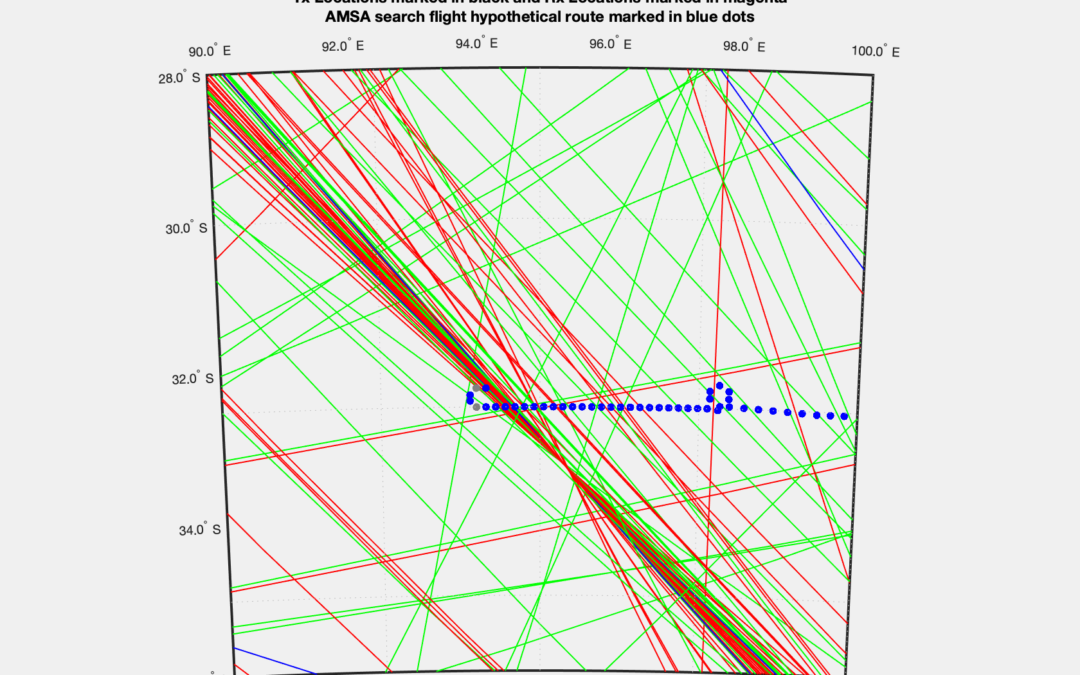
In my latest report I include the following table showing the time, latitude, longitude, altitude, ground speed and track of the RNZAF Orion P-3C aircraft (NZ4204 ICAO:C87F0A) of 5 Squadron during its flight on 28th March 2014 from Pearce AFB, Australia to the search area for MH370 in the Indian Ocean:
https://www.dropbox.com/s/yu2708c6piyy069/AMSA%20Search%20Aircraft%20Flight%20Path%2028032014%20RNZAF%20Orion%20P-3C.pdf?dl=0
Brian Anderson of the Independent Group successfully obtained under a “Freedom of Information” initiative the 183 images taken by the RNZAF Orion during the aerial search operation.
20 out of 183 images relate to the flight on 28th March 2014, which I used for a WSPR Validation Test.
Each image EXIF contains the GPS Date, GPS Time, GPS Latitude, GPS Longitude and GPS Altitude.
The RNZAF previously refused to give all the aircraft track data on the grounds that it would be too time consuming.
Would it be possible to for you to request from AMSA the flight path details (Time, Latitude, Longitude, Altitude) for this one flight only please?
Alternatively, for the first part of the flight from departure in Pearce AFB to arrival in the search area at 32.5°S 98.0°E?
Or failing that, confirm or deny the attached table is approximately correct to within 18 nm or so?
Many thanks for your help in advance.
Cheers
Richard
@All, @Brian Anderson,
I have asked Brian Anderson of the IG, who successfully obtained under a “Freedom of Information” initiative the 183 images taken by the RNZAF Orion during the aerial search operation, to request the flight path details for the RNZAF Orion P-3C aircraft (NZ4204 ICAO:C87F0A) of 5 Squadron during its flight on 28th March 2014 from Pearce AFB, Australia to the search area for MH370 in the Indian Ocean.
The RNZAF previously refused to give all the aircraft track data on the grounds that it would be too time consuming.
The request to Brian is the same as the request to Peter Foley: Would it be possible to for you to request from AMSA the flight path details (Time, Latitude, Longitude, Altitude) for this one flight only please?
Alternatively, for the first part of the flight from departure in Pearce AFB to arrival in the search area at 32.5°S 98.0°E?
Or failing that, confirm or deny the attached table is approximately correct to within 18 nm or so?
@All
I am a guest on the Howard Hughes show on TalkRadio tonight at 22:00 to 01:00 London time: https://talkradio.co.uk
The show is available world wide on digital radio. Tune your radio to ‘talkRADIO’ on DAB+ or you can listen again on-line at:
https://talkradio.co.uk/radio/listen-again/1620594000
We will be discussing in tonight’s Howard Hughes show any questions he likes about my work on MH370.
In my view, the key questions are:
1. Why is it important to solve the unexplained mystery of the disappearance of MH370?
2. What do we know of the flight of MH370, what data do we have and what data don’t we have, that we could have?
3. How can we finally solve the unexplained mystery and determine the cause of the disappearance of MH370?
I loved last Sunday’s show and especially the interview with Prof. James Goodwin on the “Brain”.
I was heartened to learn that our brains even at the age of ninety can regenerate, rewire and reconnect.
I bought the book “Supercharge Your Brain” by Prof. James Goodwin and even interrupted my reading of “You Are The Placebo” by Dr. Joe Dispenza to dive straight in to Goodwin’s book.
@Mick Gilbert
You call yourself a non-scientist but you also state that you have a degree in the social sciences. So are you a scientist or not?
You are on the record as stating: “this whole WSPR endeavour strikes me as homoeopathy on the electromagnetic spectrum”. Is your statement supposed to be taken seriously as a scientific statement or not?
Both Dr. Robert Westphal and I have made it clear that this analysis is a work in progress. Because of disinformation that is being published on a large number of web sites by a few well known analysts, I have gone to the lengths of adding a disclaimer to any publication regarding the flight path of MH370: “Disclaimer: The final major turns of MH370 are published as a paper and characterised as a working hypothesis. The initial flight, GDTAAA validation and end of flight of MH3700 are not yet published and any initial results are characterised as speculation.”
Yet you ignore this and see fit to complain to @Rob: “You’ve offered no conclusive proof that that is what occurred.” We have offered a body of evidence to support a working hypothesis, we have not offered a formal mathematical proof. In physics, a working hypothesis is valid until someone comes up with another working hypothesis more closely supported by the data. For example, I have proposed that the Malaysian authorities can publish the raw military radar data showing the actual flight path of MH370 up until 18:22:12 UTC and prove me wrong.
You also state: “You run into the same problem with two of the other stations you have used; VK6CQ in the Perth suburb of Willetton and JH3APN in Higashiosaka, Osaka. They are both close to major airports.” Whilst an aircraft may interfere with a long distance WSPR transmission at any point along the ray trace between the Tx station, various bounces in the ionosphere and earth surface (land or ocean) and Rx station within the flight level used by that aircraft, the chances of multiple aircraft interfering at the same time (± 1 second) in different parts of the globe is very small. I showed the probabilities in a previous paper on WSPR based on the density of air traffic in 2014.
You ask: “Do you have the verified actual flight path for that RNZAF flight or are you just inferring it from other sources?”
I made it clear in my validation report that the only RNZAF Orion P-3C (NZ4204 ICAO:C87F0A) flight path data I have is extracted from the embedded EXIF data in the photographs that Brian Anderson successfully obtained under a “Freedom of Information” initiative. I have asked both Peter Foley of the ATSB and Brian Anderson to request the flight details if possible.
You ask: “Relatedly, what is the track bearing for the long leg of the search pattern being flown?”
I made it clear in my validation report that the RNZAF Orion P-3C (NZ4204 ICAO:C87F0A) flight path planning used waypoints. The first long leg of the search pattern was from 32.50°S 98.00°E to 32.50°S 94.00°E. This is a track with an initial bearing of 268.925089°T and final bearing of 271.074911°T. The GDTAAA output shows an initial bearing of 269.389778°T. I am not able to detect if the pilot switched from LNAV mode to CTH during the search leg.
You ask: “Can you provide the Tx and Rx station details for the various anomalies used to plot the detections?”
Here is an Excel export with all the TX and Rx station details for the WSPR stable and anomalous links used in the validation. There are 253,486 rows in the table which includes columns with the Tx and Rx station call signs and Maidenhead codes, Spot ID (a unique integer identifying the spot which otherwise carries no information and is used as primary key in the database table), Time (unix format and UTC), 12 character TxRx Link, Tx power (dBm) and frequency, Rx SNR and drift, SP distance (km) and SP azimuth (Tx to Rx), transmission band and Rx station WSPR software version, indicators for stable links, indicators for anomalous SNR or drift links as well as SNR and drift anomalous links and finally the code generation input for GDTAAA.
https://www.dropbox.com/s/sns1nge4xz27jk9/wsprspots-2014-03-28.xlsx?dl=0
Please share the findings of your investigation in this forum.
I am glad to hear that you are “happy to keep an open mind”, whilst believing this is “homoeopathy on the electromagnetic spectrum”
I hope your enquiry is genuine. I hope you are not only interested in the “grand jury” approach. According to Wikipedia, in the USA a grand jury is usually composed of 16 to 23 citizens, though in Virginia it has fewer members for regular or special grand juries. This looks like a special grand jury to me.
@Richard
Your rank hostility to any form of proper testing of this approach does you no favours. It’s petulant. I’m out of this discussion on this forum for good.
@Mick Gilbert
Thank you for sharing the results of your research and analysis.
@David
Many thanks for your comment and you beat me to putting up a link to the latest article from Geoffrey Thomas:
https://www.airlineratings.com/news/new-mh370-breakthrough-tracking-technology-passes-rigorous-valiadtion-test/
I agree that the “blue panel” debris observed by the RNZAF Orion P-3C is neither the left nor the right Flaperon, although attempts to work out its shape and dimensions show the object is close to that of a Flaperon. Any further information that AMSA may have would be of great interest.
You make a good point whether an analysis by David Griffin of CSIRO based on BRAN2020 would come to the same conclusion. I would also point out the possibility that the right Flaperon or perhaps the right wing separated from the aircraft before impact.
I laughed my head off at the thought that the GPS data placed the altitude of the pictures taken “down under” at 184 m below sea level. I prefer to take the information from the screen shots of the onboard systems which show 643 feet at 04:08:44 UTC and 440 feet at 05:03:11 UTC.
I will answer your questions in a separate comment.
@David many thanks for your questions. I have given answers where I can.
• The screen shot at the top of page3 is indicative rather than of this day’s search? (e.g. its time would have it on the way home).
The screen shot was taken at 11:08 UTC (19:08 Perth local time) after returning to Perth. The photo on page 15 at the bottom was taken on landing in Pearce AFB. The Orion NZ4204 was photographed at 18:23:53 local time. The screen shot cannot be at 11:08 Perth local time as it shows the day’s work. I assume the clover leaf symbol is a point of interest, “IM” is an image taken, “V” might be a visual sighting, “R” might be a radar contact, “X” might be a marker buoy dropped (perhaps by a previous flight). It would be helpful if AMSA or the RNZAF explained their symbology.
• Going to the bottom of your page 6, there are numerous places where anomalies intersect. There are also a couple of blue-on-blues. Considering all these, on this and other pages, how do you know that one on the track is not just coincidence?
It could be coincidence, but it happens to be exactly where the GDTAAA predicts the position at that time based on the ground speed and bearing from previous position or progress indicators. There are matches to further position and progress indicators and they cannot all be coincidence.
• The turn at the end of the first search leg is characterised not just by the anomalies increase that you have explained but by the same with stables. Their density increase can be explained?
I am at a very early stage in formulating a hypothesis on WSPR and wake vortices. Rob has not seen this in the flights to Antarctica. I plan to try and figure out the ratio between stable and anomalous links, check sun spots, check the weather, check other aircraft in the vicinity, etc.
• As to why would there be no position indicator during the turn, that would be because aircraft bank does not encourage anomalies along the fore and aft axis? Yet there are the vortices still….
(see comment above)
• The earlier 360˚ turn at the ‘flaperon’, while of a similar radius, was not accompanied by such a concentration of progress indicators or any stables I note. A quirk of the conditions?
Quite possibly. I only showed the WSPR links at 12:12 UTC and 12:16 UTC in the report. To give the full picture there were stable links at 12:10 UTC, a single progress indicator at 12:12 UTC, again stable links at 12:14 UTC, a single progress indicator at 12:16 UTC, nothing at 12:18 UTC or 12:20 UTC and finally a single progress indicator at 12:22 UTC. It would be interesting to hear from AMSA or RNZAF whether they circled or not and if they circled then how many times they circled. Three progress indicators in 10 minutes is not a lot of evidence of a circle but some kind of holding pattern for around 6 minutes. My working conclusion is that they circled once.
Here are the missing frames from 12:10 UTC to 12:22 UTC.
https://www.dropbox.com/s/znj3leyoumgwfyd/AMSA%20Search%20Aircraft%20Flight%20Path%201210.png?dl=0
https://www.dropbox.com/s/qynoj5gi3gykgrg/AMSA%20Search%20Aircraft%20Flight%20Path%201214.png?dl=0
https://www.dropbox.com/s/j2c12jn1qwm4izo/AMSA%20Search%20Aircraft%20Flight%20Path%201218.png?dl=0
https://www.dropbox.com/s/do764gn01c3dg0q/AMSA%20Search%20Aircraft%20Flight%20Path%201222.png?dl=0
• I note the aircraft did not turn or divert for inspection of other sightings on this leg so I assume they were of low interest or none was encountered on it.
I agree. The commander wanted to accomplish the task assigned. Unfortunately it appears they still cut the final leg short by around 15 minutes out and 15 minutes back.
• The outcome has the potential to help discriminate the probabilities between postulated tracks, though no anomalies or positions detected on a postulated track does not mean rule out that track? Likewise, as you illustrate at the bottom of page 14 bottom a position indicator does not mean of course that there was an aircraft there.
A single position or progress indicator is meaningless on its own. Only in conjunction with a flight path based on a series of position and progress indicators, where the ground speed and track are only updated when a series of position and progress indicators over a time period show a change is justified. Any resulting flight path has to fit the performance capabilities of the aircraft, if the aircraft type or category of aircraft is known. At the bottom of page 14 there may be an aircraft there, it was just not the RNZAF Orion P-3C.
Here is another Airline Ratings article on WSPR and drift analysis
https://www.airlineratings.com/news/mh370-debris-hunter-blaine-gibson-pleads-co-operation/
@Richard. Thank you. I note that in your 16th May radio interview with Howard Hughes about MH370 and broadly what should happen next, as to the part of WSPR you described that as, “going through its validation phase and needs to be mature”. There does look to be a way to go yet, including the side-scatter issue.
ALSM’s quote by Joe Taylor is a serious statement if he is fully informed.
@David,
Radio amateurs have enjoyed two way world wide communication on HF bands for years. With the advent of digital communication this has become possible at much lower power levels. The radio amateur community runs a large number of contests, challenges and sprints. For example there is the DX Century Club (DXCC) challenge (DX means long distance transmission) where you have to log radio communications with 100 countries.
Radio amateurs are known to carry out crazy experiments like bouncing signals off the moon and meteors, and using sophisticated software to receive signals that are under the noise level. One of current activities is reflecting radio waves off aircraft to achieve a radio contact on very high frequencies (VHF) over much larger distances than line-of-sight.
Joe Taylor (call sign WSJT) is the inventor of a number of protocols to support various radio activities. WSJT was originally released in 2001 and has undergone several major revisions and changes in the modes that are supported (FSK441, ISCAT, JT6M, JT65, JT2, JT4, WSPR, JT9, QRA64, FT8, …). WSPR was introduced in 2008 and unlike other protocols has maintained a historic database. The protocols differ in the baud rate, message length, sequence timing and error correction algorithms used. WSPR has the lowest baud rate at 1.465 pulses per second and occupies the lowest bandwidth of 5.9 Hz. A WSPR transmission sequence occurs every two minutes and a convolutional error correction is used. FT8 has become very popular since its introduction in 2017 and uses a baud rate of 6.250 pulses per second, a message length of 13 seconds, a sequence timing of 15 seconds, a bandwidth of 50.0 Hz and a LDPC error correction.
Since retirement at the end of 2018 Joe Taylor has devoted much of his time to speaking at amateur radio events and adjudicating contests. He has organised several such events including earth-moon-earth (EME) radio transmission propagation bounce off the moon, meteor burst communication (MBC) radio transmission propagation bounce off meteor trails and aircraft scatter contacts. A document written by Joe Taylor in 2017 describes DX-ing with weak signals, monitoring propagation conditions, meteor scatter, moon bounce and aircraft scatter. Joe Taylor specifically mentions: “The ISCAT mode is especially effective for microwave contacts using signals reflected from high-flying aircraft. ISCAT copes well with the rapid changes in Doppler shift and short bursts of signal lasting a second or so.”
https://www.dropbox.com/s/08834neuzhufiwd/Work%20the%20World%20with%20%20WSJT%20-%20Princeton%20-%20Joe%20Taylor.pdf?dl=0
Referring to weak signal propagation, Joe Taylor famously stated: “As long as you are being copied, you don’t need to be loud”.
The statement attributed to Joe Taylor by Mike Exner is incomplete and misleading. Joe Taylor has never made such a statement in any publication or in any presentation on the public record. There are numerous academic papers and amateur radio reports on the application of radio signals, the WSPR protocol and WSPR network to aircraft detection and tracking. WSPRnet frequently reports aircraft reflections. Some reports are close to airports, some are far away from any airport. Some reports can be aligned with a particular aircraft, some reports leave an open question whether it was an aircraft or something else.
It is the nature of science to formulate a hypothesis and collect data to confirm or negate the idea. As in religion, there are believers and non-believers and a bunch of sceptics in between. If I am proven wrong with my hypothesis, that is fine. If I am proven right, that will add an analytical tool to the already useful Inmarsat satellite data analysis and drift analysis based on the CSIRO and other ocean models. I only ask not to be damned for trying.
MH370 passed within range of nine military radar stations in the initial part of its final flight. Later in the flight MH370 passed within range of the over-the-horizon-radar station in Australia. None of these stations have come forward with any raw radar data. Any of these stations could easily disprove my hypothesis. There are many MH370 analysts that have published papers on the MH370 civilian radar data, Inmarsat MH370 satellite data, the MH370 floating debris drift data, the MH370 hydroacoustic data, the MH370 contrails imagery, MH370 floating debris satellite imagery, and many more MH370 related subjects, but not one of these analysts has published a paper proving that WSPRnet data cannot be used to detect and track MH370.
@All,
If you want to listen to the interview on TalkRadio last night at 22:20 (UK) time, then use the following link:
https://talkradio.co.uk/radio/listen-again/1621198800#
Click start in the large black box.
Grab the red slider in order to fast forward to 21:30 in order to skip the news and commercials.
The interview lasts about 10 minutes.
@Richard. I am being selective I know.
‘Joe Taylor specifically mentions: “The ISCAT mode is especially effective for microwave contacts using signals reflected from high-flying aircraft.” ……..’
Yes but for non-microwave?
Again I speak just as one uninformed, is it worth running the above and your and Rob’s thoughts past him, in case he is not fully up with these?
At the least get clear what specifically his grounds might be if he is convinced otherwise?
@David
Joe Taylor’s protocols are designed for a range of radio bands and purposes. Aircraft scatter has been observed by him and many others across many radio bands. The quote on ISCAT only mentions “especially”, it does not say “only” or “exclusively” in the microwave band.
I am in daily contact with Rob, who did write to Mick Gilbert privately answering the questions posed to him.
Rob prefers to focus on his research and not get embroiled in arguments with people who do not understand Time Bandwidth Product (TBWP), signal energy to noise energy not pulse peak power, time on target, etc. as he thinks it will be a waste of his time.
Did Mike Exner have any communications with Joe Taylor to get that quote?
Anyway, I don’t think people, even WSPR veterans, making general statements on WSPR’s ability to detect aircraft are decisive. In my opinion, what is decisive is how MH370 analysts assess my analysis and the detailed data that I have provided. In the end the rest is just noise.
What I am waiting for, is MH370 analysts taking a deeper look into the matter and after that, either concurring or disproving it in a scientific manner. As far as I am concerned, neither has happened yet.
I am filtering out the noise, as loud as it may be. I am waiting for the signal.
I am not in the noise business. I am a signal man.
RG asks: “Did Mike Exner have any communications with Joe Taylor to get that quote?”
Yes, I have been in communication with Joe Taylor over the last few days. We exchanged a few emails. Joe was astonished to learn anyone thought the WSPR historical data could be used to detect any aircraft, including 9M-MRO. He said it was “nuts”. The following quote is verbatim what he asked me to pass on to the MH370 community. It is not “…incomplete and misleading…” as suggested by RG. In fact, it is considerably toned down from what Joe told me privately.
“I do not believe that historical data from the WSPR network can provide any information useful for aircraft tracking.”
— Joe Taylor, K1JT
Mike Exner
BTW…I received my Novice Amateur Radio License at the age of 11 (KN5KBK). Built a Heathkit AR3 receiver and a 20watt CW transmitter. Got my General a year later. As K5KBK and later W0ICH, I have years of direct experience with HF amateur radio, and DX in particular. As a teen, I operated a Heath SB300/SB400 SSB rig and 2KW pep homebrew Linear (4X 572Bs in grounded grid). 100 foot tower with triband cubical quad. Many 1000’s of DX contacts from every continent, over a hundred countries, islands, ships, and aircraft. 1000’s of phone patches for people all over the world. I have enough DX QSL cards to fill a few walls. I also participated in some DX contests and won some. So, I do know a thing or 2 about amateur radio and HF propagation.
@Mike Exner
“Nuts” is not a scientific explanation or contribution to finding MH370.
You are warned that comments will only be accepted from you in future if there is a scientific contribution.
@Richard. From your 14:42 comments, “Anyway, I don’t think people, even WSPR veterans, making general statements on WSPR’s ability to detect aircraft are decisive”, and, “What I am waiting for, is MH370 analysts taking a deeper look into the matter.”
Fair enough and your case will depend on the continuing validation and development you are undertaking.
My reservation, while observing Rob’s expertise with this novelty is that the WSPR ‘veterans’ might be able to contribute constructively and in so doing, point out difficulties.
Being out of my depth I leave that now as a thought.
@David
Rob and I need all the support we can get. There is a lot of work to do and the larger the team the better.
@Richard,
I had difficulty identifying which members of your blue dot flight path presentation were actual members of the WSPR indicator fraternity.
In the end I used the data in your table “AMSA Search Aircraft Flight Path 28032014 RNZAF Orion P-3C” to determine to my satisfaction just how sparse, or otherwise, the fraternity membership was.
The accompanying page is the result.
If I had been able to see in your presentations in your paper “When Do Whispers Shout” which blue dots were members of the fraternity, then my first inclination to think that there were very few may have been fore-stalled.
Note: The second presentation on Page 7 of 15 of your paper is labelled as being at 12:12 Perth Time. You may wish to recheck this. Perhaps there is some confusion between 12:12 and 12:10.
In the attachment I have provided “Position” and “Progress” indicators with different symbols.
https://www.dropbox.com/s/j5qtz4lncg2jk8a/When%20do%20Wsprs%20Count.pdf?dl=0
@George G
Many thanks for your excellent diagram and timeline of the position and progress indicators. It makes the flight path much clearer and the analysis of the results much easier.
I will double check the labelling on my diagrams at 12:10 UTC and 12:12 UTC.
I plan to include the full backing data similar to the table “AMSA Search Aircraft Flight Path 28032014 RNZAF Orion P-3C” in all future validation reports. If you have any suggestions on how to improve the table content and format, I would be grateful.
@Richard
You ask: “any suggestions on how to improve the table content and format”
Let’s call this “answer#1”.
You may wish to retain use of a pdf file for record purposes, and to limit accidental changes,
but:
In the original Excel File format would usually be preferable for anyone curious enough to use the data (or ‘play’ with it if you like).
This might simply be an extract from a larger file.
In other words, please consider the potential impact of very large files upon simple recipient laptop capabilities.
So, this brings us to another slightly separate subject.
This concerns your blunderbuss response to Mick Gilbert’s request for “Can you provide the Tx and Rx station details for the various anomalies used to plot the detections?” by offering him your “Excel export with all the TX and Rx station details for the WSPR stable and anomalous links used in the validation.”, which covers 27/03/2014 1600 hrs UTC through 29/03/2014 1400 hrs.
This file certainly has information, but is threateningly large. So much so that I did not even attempt to download and open it until a few hours ago.
At some stage of your preparation and documentation it will be essential to answer questions such as Mick’s.
Having actually downloaded and opened your file, I now have some questions myself, arising from a single example.
The example is Perth Time 09:20 on 28th March 2014, being 01:20 UTC on the same date. This is actually for transmissions (and receptions) over a large part of the previous two minutes, as I understand it.
Q1: Please confirm/deny my understanding.
With reference to the chart on Page 4 of 15 of your Paper “When Do Whispers Shout” this chart is relatively uncluttered with WSPR transmissions, anomalous or otherwise, in comparison to some other charts in the same document. Hence one reason for using it as an example.
There are 183 Transmission/Reception pairs tabled for this Time, Perth 09:20.
Seventy five (75) of these are tabled as being anomalous, which seems fair considering the “nature of the beast”. One would not expect (well at least I would not expect) a high percentage of flawless transmission/reception pairs. This does not necessarily mean unsatisfactory transmission/reception.
Of these 75 “anomalous” pairs (links) 38 are tabled as “SNR Anom” and 40 are tabled as “Drift Anom”. No surprise here either.
There are three (3) pairs (links) labelled as Double anomalies.
BUT, for each pair (or link) labelled as having dual anomalies, there is also an entry tabled in the Single Anomaly column.
Q2: Is this correct ? Does this mean that whenever there is a double anomaly during the something less than two minutes of transmission, there will be times during the transmission period where one or the other of SNR or drift will appear stable for sufficiently long enough to also be recognised as stable whilst also being “anomalous” during some other part of the transmission period ? Note that this might be expected of a transmission affected by something passing through, or past, the link, whereas atmospheric or ionospheric “storms” may affect reception for much longer.
As I understand it the tabled data is largely “raw” data covering the whole globe. (How could it be otherwise ?)
Q3: have any links or apparent links been “weeded out” from the data.?
Q4: Presumably the large majority of anomalous links pass nowhere Perth or even the adjacent part of the Western Australian coast.?
Q5: You paper states that there is one anomalous link which has served as a progress indicator for NZ4204 at Perth Time 09:20. Which link is this ?
Q5: Do you intend that GDTAAA will eventually automatically provide (and table) details of the link, or links, used to determine the presence of a position or progress indicator ?
Particularly during your stages of validation and initial usage of GDTAAA, it will be necessary to be able to discriminate between relevant anomalous links and links which may be “weeded out” as most likely due to some other interference factor. It will, of course, be necessary there-after in any case.
@All,
I have had a helpful and supportive response from the ATSB to my request for validation data for the RNZAF Orion P-3C flight on 28th March as part of the AMSA aerial search for MH370.
They are checking the classification of the documents relating to all the AMSA search flights during the aerial search operation for MH370. I have indicated my willingness to sign any non-disclosure agreements that may be required.
They have read my paper with interest and were planning to contact me.
The ATSB are willing to support any work towards revelation of credible evidence underpinning a renewed search for MH370.
Good Richard that’s what we need ATSB/DSTG support on whether WSPR can be used. I would say we also need to study the sim data more, which ATSB has been helping but nobody has been asking for help except Mick.
@All
There are reports that Victor Vescovo and his boat “Pressure Drop” are currently in the Indian Ocean in the vicinity of the 7th Arc. Victor Vescovo is famous for his expedition to the five deepest parts of the world’s oceans. The Five Deeps project, launched in New York in November 2018, is set to provide scientific findings from the floors of the Indian, Arctic, Atlantic, Southern and Pacific oceans including exploring the little-known Diamantina Trench, about 1125km south-west of Perth.
I am trying to get the current position of Pressure Drop and get in contact with Victor Vescovo’s team to learn what their current plans are and discuss potential crash locations of MH370. Victor Vescovo has previously expressed an interest in trying to locate MH370.
@All
Looks like the Pressure Drop is currently exploring the Wallaby-Zenith Fracture Zone, More than 7000 m deep trench between Zenith Plateau and Lost Dutchmen Ridge. Its position is about 22.25S 102.25E. This is about 60 nm west of the 7th arc.
Source: bigoceandata.com
@Arto L
Thanks for the confirmation and good to see we agree on the location.
I actually consider that super deep trench at 22 South my second or third favorite spot for MH370. My first priority favored deep spot is Broken Ridge. Part of the problem searching even at Arc7 in that 20-22 South region gets to about 20000-ft deep according to Google Earth.
If one argues, after the 2314 phone call, the pilot diverted Northeast, it fits BTO/BFO relatively well, given the active pilot assumption flexibility. However, it does not seem be consistent with the major debris drift models (Griffin or Chari).
Also that location is close to Ed Baker’s theory, whereas as Ed as pilot himself theorizes that the MH370 pilot would have stayed in the clear skies above about 22 South where the clouds became thick.
@All
The current position of Victor Vescovo’s vessel “Pressure Drop” is 22.312183°S 102.301733°E, which is 63.5 nm West of the 7th Arc.
https://www.dropbox.com/s/v59tkkd93jf0z53/Pressure%20Drop.png?dl=0
@All
I am reliably informed that Victor Vescovo is not searching for MH370, they happen to be mapping and exploring a fracture zone for scientific purposes. While the ship has the latest Kongsberg MBES, they do not have any wide-area search tools capable of detecting aircraft wreckage.
@All
If you want to follow the latest expedition led by Victor Vescovo you can do so on the web site of his media agency: https://caladanoceanic.com
@All
I have it on good authority that Victor Vescovo’s intention in the Indian Ocean in the vicinity of the 7th Arc is purely scientific and is not related to MH370.
Victor Vescovo’s ship “Pressure Drop” and equipment on board are not suitable for searching for MH370.
If that changes, I will let you know.
If this is the expedition I am thinking about, we discussed it several years ago. at the time I was advised (probably by ALSM or DonT) they are researching very small specific drop points, so the ability to search for MH370 debris was not considered feasible. Interesting science though.
Maybe we could ask them to submerge an aircraft fire bottle so we can measure the sound of the implosion.
@All,
On Thursday 13th May 2021 an Indonesian fishing vessel was caught in a storm in the Indian Ocean and sent out an SOS as it started to take on water and slowly sink. The location of the vessel was 725 nm West of Perth, Australia. There were 32 knot winds in the area:
https://www.dropbox.com/s/3ihim590gfj68yc/Surface%20Winds%2013MAY2021%202100%20UTC.png?dl=0
The Australian Maritime Safety sent out their Bombardier 604 Challenger jet operated by Cobham SAR services to locate the fishing vessel and drop life rafts. The AMSA jet was joined by two Poseidon P-8A and a Hercules C-130J from the Australian Defence Force. The AMSA Challenger jet located the fishing vessel at 31.2175°S 101.8832°E:
https://www.dropbox.com/s/7dpr9h7x9ks4rsl/%20Indonesian%20Fishing%20Vessel%20and%20Crew%20ViDAR%20054354.png?dl=0
The AMSA Challenger jet has a ViDAR Sentient 3 camera array and can automatically detect and track objects in the water:
https://www.dropbox.com/s/6rdkdflspm7gx28/AMSA%20Bombardier%20Challenger%20604%20Cobham%20SAR%20Services.png?dl=0
A Japanese fishing vessel, the Fukuseki Maru 15, was diverted to the location and the twenty man crew were rescued. An Australian Navy ship HMAS Anzac arrived soon after on the scene and took the men on board, as it had medical facilities. One of the men was injured and was later flown to Perth using the MH-60R helicopter onboard HMAS Anzac.
@Rob detected the AMSA Challenger jet on various sorties from Perth to the fishing vessel and back, using especially WSPR links between radio stations VK6xx in Australia and ZS3xx in South Africa on 7 MHz.
In his email to Mick Gilbert on Sunday 16th May 2021 at 20:27 CET, @Rob stated: “If you want to drill your capabilities: Cobham Air SAR services recently flew several sorties for AMSA out of Perth for the rescue of the crew of 20 men on a sinking Indonesian fisher boat 670 nm west off PER. So look and see in WSPR if you can find s.th. interesting at 7 MHz.”
I ran the scenario through GDTAAA and here are the results. The AMSA Challenger descended to around 500 feet and circled the fishing vessel on 14th May 2021 at 07:40 UTC (15:40 Perth time) when a single anomalous WSPR link progress indicator picks up the aircraft:
https://www.dropbox.com/s/ql4yz6ajzzbfm2o/GDTAAA%20AMSA%20IN%2014MAY2021%200740.png?dl=0
At 07:42 UTC there are 3 anomalous WSPR links forming a position indicator:
https://www.dropbox.com/s/4bclhrkyznbztnr/GDTAAA%20AMSA%20IN%2014MAY2021%200742.png?dl=0
At 07:44 UTC another progress indicator:
https://www.dropbox.com/s/z3jbj81qgn46j9c/GDTAAA%20AMSA%20IN%2014MAY2021%200744.png?dl=0
At 07:46 UTC another position indicator with 3 WSPR links:
https://www.dropbox.com/s/2pmxirr8ifs8ft7/GDTAAA%20AMSA%20IN%2014MAY2021%200746.png?dl=0
At 07:48 UTC another progress indicator:
https://www.dropbox.com/s/uc84auzcx35n5uw/GDTAAA%20AMSA%20IN%2014MAY2021%200748.png?dl=0
At 07:50 UTC another position indicator:
https://www.dropbox.com/s/gak9v746592kfel/GDTAAA%20AMSA%20IN%2014MAY2021%200750.png?dl=0
In general in 2021 there are far more WSPR links available in the WSPRnet database than in 2014. In this particular case there are 810 globally every 2 minutes. In the 10 minute period above there are 15,485 global WSPR links out of which 4,863 show an anomaly. There are of course relatively few WSPR links crossing the area of interest in the Indian Ocean. I have marked SNR anomalies in red, drift anomalies in orange and double SNR and drift anomalies in blue. The flight path of the AMSA Challenger jet is marked with grey dots every two minutes and a grey line. The current position of the aircraft is marked with a blue dot. This area is relatively close to the MH370 search area and so this is a good test of GDTAAA.
The database of WSPR links used is attached in Excel format:
https://www.dropbox.com/s/339gouckxc0ukxw/wsprspots-2021-05-14-0740%20Anomalies.xlsx?dl=0
@George G
Many thanks for your helpful suggestions and questions.
I will always attach an Excel table to allow other to use the dataset for any particular scenario.
I will keep data sets small. For example today I attached an Excel for the Cobham SAR Services scenario for 10 minutes of flight with only 4,863 rows by excluding all the stable links.
WSPRnet only provides data by the month. The last full month April 2021 was 6.28 GB and contains 74,579,477 rows. Even a 24 hour period will exceed the maximum of 1,000,000 rows in Excel. In 2014 there was much less WSPR data volume.
I did warn Mick Gilbert, that his data request was large but it was in fact only 38 MB and I sent it using dropbox. He asked for the “details” and it was clear from his various comments that he wanted to do his own analysis. The file only contains 253,486 rows which is well within the capability of Excel or Numbers at 1,000,000 rows. I took his request seriously and I do not understand his response as I answered all his questions in full.
The MH370 GDTAAA files are even bigger and the drift ocean models are bigger again.
I too only have an old laptop so I have to look at the hour glass for quite a bit of my life. Some of my Matlab scripts have to run over night and are still going when I wake up the next day.
You are correct that there are only 183 rows at 01:20 UTC, 75 anomalies, 3 double, 40 drift and 38 SNR. I have now decided to colour SNR red, drift orange, double blue and stable green.
There is no double counting as the software only allows one case either stable, single SNR, single drift or double anomaly. I check for a double first.
I run a check on the number of stable and the number of anomaly links, just in case something strange is going on. It shouldn’t be all stable or all anomalous. There are dependencies on the solar cycle, time of day or night, grey line near dawn or dusk, electromagnetic storms, meteor trails, etc. but generally speaking most links are stable.
I also check an anomaly is not there 2 minutes beforehand and 2 minutes after. I am looking for a transient anomaly and not a permanent anomaly. An aircraft is definitely a transient disturbance, even the forward scatter or wake are transient.
The datasets for each 2 minute time slot are global and the GDTAAA plots all short and long paths. I now distinguish in the output between the short and long paths crossing that region of interest. The short path is in the same colour scheme but a darker variant. For example a stable short path is dark green and a stable long path is in light green.
I do not use links with a 4 character Maidenhead code. I only use links where both Tx and Rx stations have a 6 character Maidenhead code in order to achieve the accuracy of the great circle at any point to within 18 nm.
I do not use links where the Tx and Rx station are in the same 2 character Maidenhead grid square because the distance between Tx and Rx stations will be small.
Links cover all the globe. There are few places that escape. With over 5,000 WSPR stations globally the coverage is comprehensive. Here are Figures 1 and 2 from my paper Global Detection and Tracking of Aircraft in the Search for MH370 dated 1st May 2021 on the Final Major Turn(s) post. Perth has several WSPR stations. Western Australia is well covered and in Figure 2 you cannot even see Australia.
https://www.dropbox.com/s/9mijhz1uxsxajmu/Global%20WSPR%20Coverage.png?dl=0
I have automated the process already quite extensively. I could imagine that an artificial intelligence program would be better at hunting for patterns than a human analyst but I have not got that far yet.
I have a table of all the links, which is what you call a blunderbuss. As you point out, even at just one point in time like 09:20 there are 183 links. You ask which one is used as the single progress indicator. It is spot id 191351486 from Tx W1CK at EM48ux to Rx W4DJW at DM13ie as shown in the link below:
https://www.dropbox.com/s/gf7ronx1q1ridx7/AMSA%20Search%20Aircraft%20Flight%20Path%200920%20Global%20View.png?dl=0
In future I plan to implement automatic generation of the table of progress and position indicators but this requires an automated connection between the flight tracking and WSPR link tracing modules.
In future I also plan to include ray tracing automatically, but this is complicated and requires an add on toolbox to Matlab. Here is a link which I included in a comment dated 12th March 2021 at 11:35. This is an example between Tx HS0ZKM at OK03GR in Bangkok, Thailand and the MH370 Last Estimated Position (LEP) and then on to Rx VK6ZRY in Perth in the following link. The ionospheric ray-tracing was run on 8th March 2014 at 00:20:30 UTC by Rob.
https://www.dropbox.com/s/wypbkfn8fv2k1v5/2021-03-09%2020_28_19-Proplab%20Ray%20Tracing%202021.03.08%2000_20%20h%20UTC%20HS0ZKM%20LEP%20IG.png?dl=0
https://www.dropbox.com/s/86zsiu2wiqbvbgr/2021-03-09%2014_51_21-Proplab3.1%20Ray%20Trace%20LEP%20IG%20to%20PER%202014.03.08%2000_20%20h%20UTC.png?dl=0
I hope this helps and if anything is not clear please let me know.
@Richard
Re your reply at 2310 18th May
That is a pretty comprehensive description.
I realise that much of the information has been presented previously,
but there is much fresh (at least to me) information too.
I expect it will all have to be in your final documentation, regardless.
___
The rescue of the fishermen became fortuitous with regards to provision of another trial example.
And fortuitous for them that there was another fishing vessel able to assist.
Do you intend to also trial track the other aircraft involved ?
___
Double counting:
Example:
Refer to your recent database in Excel format for the AMSA/Cobham aircraft:
Refer to the first information (data) row with Spot ID 3042826876.
SNR 1
Drift 1
Double 1
Single 1
Stable Zero (to be expected)
The first 94 data rows are all the same.
___
As per my previous suggestion,
Perhaps the system “sees” an anomaly in either SNR or drift at some time during the period of transmission/reception, whilst the other (of drift or SNR) remains stable for long enough to be recognised as “stable” during this time,
Hence generating a “Single” report,
but nevertheless itself also becomes “an anomaly” at another time during the same period of transmission/reception,
Hence then generating a “Double” report.
(Taking note that the period of transmission/reception is a large part of two minutes)
Or ? What else ?
___
In addition to your reality checks, I expect and hope that you, or the system, is keeping a chronological record of balance between stable and anomalous results. This may then be useful in conjunction with other records. For example, one might expect that return to pre-2020 aircraft flight density might be a significant factor ?
Additionally, for high air traffic regions such as the USA the balance may be skewed in comparison to some other regions ?
Of course, all the other factors you mentioned will have their effects.
Quite possibly such a record may already be in progress, separately from GDTAAA.
___
You write, for the progress indicator for NZ4204 at Perth Time 09:20 on the 28th March 2014 (01:20 UTC): “spot id 191351486 from Tx W1CK at EM48ux to Rx W4DJW at DM13ie as shown in the link below:”
I think you meant “Tx W1CK at DM13ie to Rx W4DJW at EM48ux” if I am reading the spreadsheet correctly.
(And also with reference to the Maidenhead grid)
But, I am having difficulty interpreting the direction in which the WSPR link is passing “through” or “by” the location of NZ4204 at Perth Time 09:20 on the 28th March 2014. (01:20 UTC)
The Global view shows both transmitter and receiver in mainland (or contiguous) USA. Global view re-linked below for general ease of reference.
The distance of 3213 km in Column S of the spreadsheet refers to the distance between transmittter and receiver, as you state in your reply to Mick Gilbert of 16 May 2021 at 17:15. (Certainly the distance to the Australian seaboard near Perth is much greater in either direction.)
Similarly, the Azimuth of 77 tabled in Column T is from Transmitter to Receiver.
It would make some sense that the partly interrupted or diverted transmission from DM13ie to EM48ux would be via the long path around the earth via (over, perhaps bouncing off) the Pacific and Australia to the the location of NZ4204 on the West Australian coast at Perth Time 09:20 on the 28th March 2014.
The long path.
What follows may seem a nonsense question, but let’s make it clear:
I assume that paths eastwards from Transmitter W1CK at DM13ie and received from the west by W4DJW at EM48ux are all assumed to NOT have been around the earth once plus the 3213 nominal distance between Tx and Rx.
For the uninitiated, how is this assumption made valid ?
( Signals received from the east by W4DJW at EM48ux from Transmitter W1CK at DM13ie via the long path are really not-that-much-shorter, being approximately 85% of the assumed nonsensical path)
This “nonsense” question might only really apply to “drift” anomalies ?
For the record, the example at Perth Time 09:20 was a signal strength anomaly.
https://www.dropbox.com/s/9mijhz1uxsxajmu/Global%20WSPR%20Coverage.png?dl=0
@George G
Many thanks for your helpful suggestions and further questions.
I intend to document the GDTAAA system without compromising my Patent Application (No. 21020247.9). I am glad you found the description pretty comprehensive.
I agree that there are no stable links in the table that I provided for the Cobham SAR Services flight, as I mentioned I removed them to reduce the size of the table. I can easily publish the full table if you wish.
There is no double counting. In the example you gave, although the indicator flags for SNR, Drift, Single and Double are all set, the software takes this as a Double. If the Double flag is set then the other flags are ignored. In my software, there is an if … else if … else if … statement.
In the example I gave there are 4,863 rows of which the WSPR software version in use by the receiving station is blank for 2,105 rows. The “Version” column may be blank, as versions were not reported until version 0.6 or 0.7, and version reporting is only done through the realtime upload interface (not the bulk upload). For the other 2,848 rows there are 42 different software versions mentioned. I have not yet analysed all these different software versions to see how they work and what the differences are. You maybe right in what the system “sees”. As far as I understand the SNR and Drift are determined only once the complete WSPR protocol has been received.
I have noted the ratio of stable and anomaly links in various scenarios, but I think that it would be an interesting analysis in its own right to study the stable and anomaly WSPR links at different times and regions and locations. Any correlation with aircraft density, airport proximity, flight route proximity, solar cycle, aurora borealis, meteor showers, grey lines, etc would perhaps provide the basis for more sophisticated algorithms detecting anomalies.
Thank you for spotting my error reversing TX and Rx. WSPRnet puts the Rx first and I prefer the Tx first. There is obviously a deep subconscious difference between radio amateurs where it is all about receiving and physicists were a transmission has to come before a reception. There is also a typo in my comment, the Rx grid locator should be EM84ux and not EM48ux.
I love nonsense questions, because they are usually anything but nonsense. One problem that I have is that I do not know what antenna was used by the Tx and Rx stations. If you assume the transmitter uses an isotropic antenna then in this hypothetical case the antenna gain is the same in every direction and the short path and long path transmissions differ by the length and propagation conditions. If you assume the transmitter uses an antenna with a symmetrical gain pattern then we can assume the same gain on each azimuth (N-S, E-W, …). It the antenna has a main lobe and a back lobe, then what is the gain in each direction? If the antenna is unidirectional then the azimuth is presumably the short path azimuth included in the WSPRnet table. What we do know with WSPR is that the Rx station copied the Tx station and the Rx station knows the Tx dBm, the Rx SNR and the Rx drift.
In the example you quote the Tx station W1CK at DM13ie is 3,220 on the short path to the Rx station W4DJW at EM84ux and 36,778 km on the long path. Both are possible. I am not assuming only the short path transmission happens. An assumption only arises, if you assume the long path transmission cannot occur. We know for certain that both the short path and long path transmission can occur and so no assumption is required. The GDTAAA system does not rely on one transmission but on a series of position and progress indicators that fit the target aircraft’s performance and previous ground speed and track data. A single false positive will not change the GDTAAA output.
@Richard,
Re your 19 May 2021 at 16:35
You say: “… no stable links in the table … removed them to reduce the size of the table.” Understood.
I certainly see no need to publish them, unless someone requests them.
I only listed “Stable Zero” in my short list simply because this was the value in Column N of your file wsprspots-2021-05-14-0740 Anomalies.xls. It was included only to “complete” or end the list.
Thank you for your flag explanation. Understood.
Even so, I am sure that I won’t be the first or last to be flummoxed by this.
Perhaps you might even consider transposing Columns L and M so the the “Single” is listed first, and someone like me then will read it more like:
“There is at least one anomaly, but, look, there are two.”
Your software flag explanation precludes any need for further explanation, but thank you for your version explanation and “As far as I understand the SNR and Drift are determined only once the complete WSPR protocol has been received.”
Concerning the nonsense question, I note your reply of 19 May 2021 at 13:58 to David, where you write: “I only account for a difference in the short path to long path attenuation by the difference in the distance travelled. I use a distance algorithm prior to determining if the received SNR is outside the standard deviation.”.
In fact, as a result, I had intended to withdraw the question this morning.
And YES, I think I had already read, but forgotten, that you use a means for accommodation of loss of signal strength over distance.
It is also an interesting thought to consider an interruption, or disturbance, the second time around. Might this sometimes contribute.
I was tempted to suggest that only one of those dastardly hard to find UFOs would be quick enough to interrupt (or disturb) the first pass and not also the second, but I digress.
More seriously, your indication in your graphics of the various types of links is appreciated. (Even though I, myself, have yet to be find a clear certain comparison of a short versus a long path link, but this may simply be an individual eyesight characteristic.)
@All,
A retired A330/A340 airline Captain wrote to me yesterday congratulating me on my WSPR research and asking for details of the flight path that I hypothesise.
My reply to him was based on the following observations:
1. What track fits the MH370 9M-MRO SATCOM data as provided in the communication log from the Inmarsat satellite BTO and BFO data.
2. What track fits the MH370 9M-MRO Boeing 777-200ER aircraft performance and engineering data from Boeing and MAS Engineering.
3. What track fits the MH370 9M-MRO flight path WX data as provided by GDAS.
4. What track fits the MH370 9M-MRO civilian radar trace as provided by ATC.
5. What track fits the MH370 9M-MRO ADS-B data as provided by ATC.
6. What track fits the MH370 9M-MRO WSPR intersect data as provided by WSPRnet every 2 minutes during the flight.
My conclusion is that the aircraft was in LNAV mode and used a number of waypoints including:
1. “Cancel SID” and a “Direct to IGARI”.
2. Flight Plan turn towards BITOD.
3. Diversion between IGARI and BITOD to KADAX.
4. OMGAK.
5. ENDOR (WMKP STAR).
6. OPOVI (WMKP STAR).
7. Turn between OPOVI and VAMPI to TASEK.
8. DUAMO.
9. ANSAX.
10. POVUS.
11. BEDAX.
12. Turn before BEDAX to DOLEM.
13. 0292S.
14. MUTMI.
15. Turn after MUTMI at intersect with flight route N640.
16. 99SP, S90EXXXXX or S90WXXXXX.
Neither Constant Magnetic Track (CMT) nor Constant Magnetic Heading (CMH) “curved” trajectories fit the data.
I also do not believe the pilot switched the Heading Reference Switch (HDG REF) from NORM (Magnetic North Reference) to TRUE (True North Reference) to allow Constant True Track (CTT) or Constant True Heading (CTH) navigation modes.
“Neither Constant Magnetic Track (CMT) nor Constant Magnetic Heading (CMH) curved trajectories fit the data”
assuming what though? no descent or slow down after Arc5?
DrB in the past showed a number of CMT and/or CMH paths with decent fit. In DrB’s case it was passive flight, but DrB’s fuel model shows a marked slow down as aircraft weight gets lighter due to fuel consumption. Although I am little worried about the fuel model for that situation, I have no problem with active pilot slow down/maneuvers.
@TBill
I laid out my 6 assumptions in my comment above in this chain.
A passive or active pilot is not on the list of my assumptions.
The hourly BTOs may allow certain manoeuvres in between, but the two minute WSPR data constrains the track with a higher granularity.
I agree the fuel range and endurance has to fit a fuel exhaustion at around 00:17:30 UTC.
@All,
On the basis the hijack and diversion was carefully planned, the final crash location would also be carefully planned. Speculation about the choice of end location being the most remote, deepest and difficult to find is plausible and bears wider consideration.
With Victor Vescovo currently investigating the deepest parts of the Indian Ocean near the 7th Arc, we may be in for a surprise discovery of more than a new genus or species.
I received the following thought provoking message yesterday from a deep thinking individual:
“I have long followed the progress of the research around MH370 and was reinspired recently to allow some deep thinking time again after your WSPR disclosures. I am NOT versed in the science of your discoveries but as more and more insight is granted into the given depth of planning and execution around the event that your WSPR disclosures confirm, I ask why then would the specific location to “land” not also be pre selected? If the “flyer of the plane”, the one directly controlling it to avoid detection, intended not to be found during the act then can that same line of thinking be applied to the post events outcome as well? Being a serial tech entrepreneur and proven deep problem solver using data I felt to share given Occam’s Razor and what you have found to date. If a “pilot” can land on a small strip of land why would said MH370 “plane flyer”, which displayed great knowledge of avoidance, also not have planned to land on the deepest possible ocean ravine the plane could reach? The “flyer” would undoubtedly know that civilization would never stop looking for the aircraft, aka Amelia Earhart, so to keep that going for the longest time, and thus the memory and legacy, putting it in the absolute hardest place to locate aligns with other details found to date does it not?
Total speculation on my part but with so much detail taken I cannot think that just letting it fall from the sky would be the end. Maybe crash simulations from the located pieces that have surfaced will reflect otherwise but having always been one to speak up I figure what could it hurt by reaching out.”
The “deep thinking” person voices an opinion (intentional crash in hard to find area) that, among those who feel the pilot did it, most, or at least many agree with. However, the search to date has been mostly based on passive crash near Arc7, assuming the pilot had no intention whatsover to crash the aircraft in a hard to find location.
OI’s 2018 extensive search of Arc7 was very exciting, even for active pilot advocates. But now the close-to-Arc7/passive flight assumptions are looking much weaker to me. However it has been said active pilot is NOT an acceptable assumption for Malaysia, and is repulsive for many observers. So it is politically incorrect for a large number of reasons.
I believe that (active pilot) analysis has not been done very thoroughly, and if it were ever done, it would probably need to be behind closed doors.
I know BG feels we do not need a divisive active pilot assumption: Murphy’s Law alone tells us it could well be in Broken Ridge, and Griffin’s/Chari’s debris analysis gives a non-political way to search without needing to consider what the pilot actually did.
However, I would say, behind the scenes, it could be instructive to look at how far into Broken Ridge the pilot could have flown in a worst case scenario. To date we have been making many simplifying assumptions of a non-worst-case scenario. The worst case scenario does not scare me, OK is scares me a little, but I think we might be able estimate where the crash happened, and then we have to get lucky finding debris that got away from the main wreckage if the main wreckage is >20000-ft deep.
@Richard. About your 18th, 18:33, the times have me confused. You have the Challenger arrival at the scene at 0746 UTC but your second URL has arrival some 2 hrs earlier. This and other photos and videos, described by AMSA as being taken from the Challenger, confirm the latter:
https://media.amsa.gov.au/media-release/20-indonesian-fishermen-rescued-western-australia
You have the winds in the area at 32 knots, taken from your first URL I think, which has direction from 090. However on reversing course from 270 the aircraft ground speed difference is but 13 knots, that breeze being from the west.
From the white caps the seas look to be about force 3 on the Beaufort scale, 12-19 knots. So while the winds might have been 32 knots early that morning they seem to have moderated. However from the AMSA photos and videos that breeze appears to be from the east.
Probably I am asking too much of accuracy but I mention this also out of interest as to the vessel’s drift angle. From the AMSA site, from the first Challenger sighting to that at night, assuming the wind remained from the east all day through to the 13:47:25 IR video, the vessel drifted about 40˚south of the wind.
Looking at the swell in those videos the personnel transfers would have been demanding.
Adding these Challenger flights to the P8 and C-130 flights there would have been several that day.
Some questions, albeit basic, on your track diagrams please:
• In the first the latitude on the red anomaly, not coincident with either nearby orange and thereby fixing position, is set on the red by knowing the destination lat and long?
• In the second, that at the quadruple crossing to the SE is disregarded for the same reason?
• In the third, why prefer the red on red over the red on the close orange? Just a toss-up?
• Can you confirm that if a much higher and lower speed band were chosen there would be no solution?
About your 23:10 post, “I now distinguish in the output between the short and long paths crossing that region of interest.”
I refer to your second URL. I imagine there will be considerable attenuation on the long path. How do you distinguish between interference/ modulation on the long and short paths please? Related, how do you distinguish SNR change from attenuation to that due to interference? The step in it?
One mainly from curiosity in case you know – if a WSPR signal can makes it around the world the station transmitting could receive its own signal?
Finally, “The ionospheric ray-tracing was run on 8th March 2014 at 00:20:30 UTC by Rob.” Skip distance in the instances you illustrate vary from 1350 km to some 4000. That can mean quite a few skips.
Thank you for your willingness to answer questions as you develop your hypothesis.
@David
The AMSA Challenger flew several sorties from Perth to the distressed Indonesian vessel and stayed on station for much longer than the short excerpt that I depicted. The useful link that you provided has videos from 14MAY2021 starting at 05:43:51 UTC, 07:45:53 UTC in daylight and 13:47:25 UTC at night time.
In the two hours between the first two videos, you can see the position of the “target” drifted 81.5 nm westwards on a bearing of 209.7°T, being pushed by a strong wind from the East. According to GDAS the wind did not moderate very much but changed direction 30°. I depicted the wind on 13MAY2021 at 21:00 UTC which was 59 kmh from 090°T. The SOS was first made on Thursday. The AMSA Challenger first departed on Friday morning at first light. The wind on 14MAY2021 at 06:00 UTC was 58 kmh from 060°T and at 09:00 UTC was 53 kmh from 060°T.
In my graphics I tried to show the position of the vessel at the time in the graphic title. Unfortunately I did not update the position of the vessel every two minutes, just the position of the aircraft. The ViDAR image at 07:46:00 UTC shows the position of the target at 31°:14.42’S 101:50.51’E (31.2403°S 101.8418°E) whereas I had positioned the vessel in my graphic at 31.240°S 101.836°E.
https://www.dropbox.com/s/qk0j5e7lnsz0lp0/%20Indonesian%20Fishing%20Vessel%20and%20Crew%20ViDAR%20074600%20UTC.png?dl=0
The ViDAR image shows the target 0.5 nm due North of the aircraft at 31°:14.72’S 101°:50.11’E. In my graphic at 07:46 UTC I incorrectly show the aircraft to the South East of the vessel.
https://www.dropbox.com/s/2pmxirr8ifs8ft7/GDTAAA%20AMSA%20IN%2014MAY2021%200746.png?dl=0
I agree the ground speed increases into the wind but I assumed this was because the pilot increased thrust into the strong head wind to ensure aircraft manoeuvrability in the buffeting. If you want to step through the 29 second video starting at 05:43:51 UTC and the 8 second video starting at 07:45:53 UTC in the AMSA link you provided and note the position of the aircraft at each second you can work how far the aircraft moved each second and get the average ground speed over the 29 second and 8 second period. That may resolve your quandary about the 13 knot difference in ground speed.
I only account for a difference in the short path to long path attenuation by the difference in the distance travelled. I use a distance algorithm prior to determining if the received SNR is outside the standard deviation.
Usually amateur radio operators are either transmitting or receiving at any particular moment in time. It is an interesting thought that a WSPR station could receive its own transmission after having travelled around the world. At the speed of light a radio signal will travel 8 times around the globe in each second, but the subsequent received signal will be somewhat less than a whisper.
@Richard. My thanks.
Earlier you said, “I ran the scenario through GDTAAA and here are the results. The AMSA Challenger descended to around 500 feet and circled the fishing vessel on 14th May 2021 at 07:40 UTC (15:40 Perth time) when a single anomalous WSPR link progress indicator picks up the aircraft:”
From the AMSA videos at 07:40 the Challenger had been in the vicinity for nigh on 2 hours. On arrival a liferaft was evident. By 07:46, the end of AMSA photographic coverage on its site from this sortie, there were two liferafts attached to the vessel and about 7 crew remaining. Presumably the other 13 or so had got off by then. For some reason that ‘about 7’ still remained onboard in the IR video that night so there was more to be done and more sorties to follow. However since there is no more media coverage those may not have been by the Challenger.
It isn’t clear why the aircraft would have descended to that ‘single anomalous WSPR link’ at 07:40 and, as it happened, on a 270˚ course as if from Perth. Isn’t it more likely that he had been circling there for two hours by that time, undetected by WSPR? However even then a first pickup of the aircraft on that course would be coincidental.
Similarly, were he descending from a hold at altitude to save fuel, again it would be coincidental that the initial detection happened to be on that course.
So it might be worth having another look at that first link?
Also, from the above, “The AMSA Challenger….. stayed on station for much longer than the short excerpt that I depicted.” At the end of that, 07:50 , you have him heading west, apparently still orbiting. That absence of media-release coverage after 07:46 might be because nothing else happened prior to the trip home. In that case he might have ascended to loiter locally until that time came. However since apparently he was not picked up while transiting out to the vessel, the chances are he didn’t?
@David
My apologies, I was not very clear! I did not mean to imply that all we have is 10 minutes of information.
@Rob and I have tracked several AMSA organised flights to the Indonesian vessel in distress. I have only shown a 10 minute snapshot out of a much larger set of data and a much larger flight tracking of various aircraft in various sorties for much longer periods of time. The 10 minute snapshot is already 23 files and 145.5 MB of data.
We are back to the issue that @George G raised. I could show a lot more but the data files are either too many or too large.
If there is a particular timeframe you are interested in, please let me know and I will share the results. Please bear in mind that even a 10 minute snapshot is quite a large data set.
I am currently running the whole flight of MH371 through GDTAAA and I think that will be more enlightening as to the GDTAAA system and process.
@Richard. My second last paragraph should read “….first link at least?
@Richard
What do you think may have been the reason for all the course changes in the mh 370 flight path off the northwest coast of Sumatra ?
@BG370
The pilot in command (PIC) of MH370 used a number of changes in course to mislead anyone watching as to the intended route or destination. The PIC heads into the Malacca Strait, firstly toward the Andaman Islands, then toward Sumatra, then toward the North West again, then South West, then East back along the southern coast of Sumatra, then South West again. From this ever changing pattern it is not possible to determine what might come next or what the intended destination might be. This game ceases when the aircraft enters the Melbourne FIR and is south of waypoint MUTMI and crosses flight route N640. Then the flight path is due south. At this point the aircraft is out of sight of all radar and other aircraft traffic.
The PIC was not confused or hesitant or indecisive, he was laying false trails and covering his tracks. This tactic worked for the diversion in choosing the moment of handover between the Kuala Lumpur FIR (or delegated Singapore FIR) and the Ho Chi Minh FIR between waypoint IGARI and waypoint BITOD. The PIC also broadly followed the boundary between the Kuala Lumpur FIR and Bangkok FIR following diversion passing waypoint OMGAK on that boundary. Later the PIC passes waypoint TASEK on the boundary between the Kuala Lumpur FIR and the Jakarta FIR. Waypoints ANSAX to POVUS again follows this FIR boundary. Finally 0292S is where the Melbourne, Jakarta and Colombo FIRs meet.
This flight path follows waypoints and FIR boundaries, but most of this route is not following recognised commercial flight routes. To the casual observer this may appear indecisive or that the PIC was making the plan up as he went along. In my view, this flight path was carefully planned and executed in a cold and calculating manner. The intent was to lose the aircraft in a remote location where it would be very difficult to find. That plan has (so far) succeeded for more than 7 years. Just enough fuel was “wasted” setting false trails, just enough fuel was conserved to get to a remote location.
There are those critics that say that the PIC was on a final flight and he was relieved of any constraints to fly according to the book. There was no need for waypoints, he could adjust his heading according to the winds encountered, he did not care about saving fuel.
There are others who say this was carefully planned and therefore the end point would also be carefully planned.
I observe the data and note that many waypoints and FIR boundaries were passed but few flight routes were followed. My hypothesised flight path is neither by the book, nor to a well defined end point. It was more important to hide the aircraft than to save fuel, more important to lead anyone watching astray than to get to a particular crash location.
@George G
Many thanks once again for your valuable and helpful criticism and comments.
I take on board what you are saying about the confusing flag indicators and will make the change you suggest. It is one thing to set flags for the software generation, it is another thing to use flags for the documentation. As you can see, I am trying to generate self documenting software, but this can be improved to ensure traceability of the results.
I also intend to enrich the WSPRnet data further with a flag whether I use the short path (SP) or long path (LP) and the long path distance (km).
Eventually I would like to enrich the documentation with flags for the position and progress indicators used, and in each case the 12 character Maidenhead grid TxRx link and WSPRnet spot id that intersect with the target aircraft flight path.
There are 3 layers in the GDTAAA output generation:
1. The aeronautical chart layer with the airports, waypoints and flight routes.
2. The target aircraft flight path layer with the current position and 2 minute track indicators.
3. The WSPRnet layer with the stable links, SNR anomaly links, Drift anomaly links and Dual anomaly links together with the SP or LP indication.
There is a limit as to how much information you can show in a multi-layer chart and the chart information needs to be supplemented by tabular information that is self evident and provides complete traceability.
A work in progress!
@David, @George G,
I greatly appreciate both your comments.
You are both very thorough and have raised a number of helpful points.
I have tried to answer you both in full, because I am convinced that you are speaking for many other readers.
Would it help to have the previous 10 minutes worth of AMSA Challenger flight tracking or another 10 minute snapshot from a completely different time or both?
If the ATSB comes up with the AMSA MH370 aerial search data, that will be great.
MH371 will also be a very helpful validation test.
The Indonesian fishermen’s plight and the AMSA Challenger Cobham SAR Services rescue is also a great validation test.
All these tests contribute to a fuller understanding of the WSPR technology and how this can be used to help solve the mystery of the disappearance of MH370.
GDTAAA has a long way to go to become a mature and validated system and process.
@Richard. We crossed!
Appreciate your thoughts and offer thank you. For my part the previous Challenger 10 minutes would indeed help, even 5.
Richard,
I echo David’s words, other than I think the full ten minutes may be necessary.
My guess is that you will find the aircraft was on station.
At least predicting and searching for the previous position will be a valid demonstration of your methods, but in reverse to your usual description.
You have previously written: “This area is relatively close to the MH370 search area and so this is a good test of GDTAAA.” Agree.
@George G
I will pull together the data for the pervious 10 minutes of the AMSA Challenger flight to the stricken Indonesian vessel.
My usual description is a “work in progress”, a “working hypothesis” when there is enough evidence or “speculation” when there is little evidence. I have been falsely quoted as claiming I have found MH370 by some well known MH370 analysts, so I have become cautious and put a disclaimer notice on my charts. Nevertheless some people have gone to the lengths to remove or cover up the title from my charts with the word “hypothetical” and publish my charts with a misleading substitute statement on various web sites.
The MH370 FMT paper claimed 7 position and 55 progress indicators in 3 hours 42 minutes of flight. There were between 150 and 300 WSPR links every 2 minutes. The number of links reduces the further south you go into the Indian Ocean.
The AMSA RNZAF Orion P-3C report claimed 9 position and 19 progress indicators in a 3 hour flight from Perth to the search area. There were around 100 WSPR links every 2 minutes.
The AMSA Challenger rescue flight to the stricken Indonesian fishing vessel showed 2 position and 4 progress indicators in a 10 minute snapshot. There were around 800 WSPR links every 2 minutes.
Some critics have already made the comment that with 800 links every 2 minutes I am bound to find a few matches to any flight path.
The MH371 analysis covers a flight of almost 6 hours and at take off in Beijing there are only 150 WSPR links in 2 minutes. In 2014 there were significantly fewer WSPR links than in 2021.
@Richard,
We could compromise.
You could look 10 minutes back.
If the aircraft is on the incoming track as you expect, then a larger step than 2 minutes, say the ten minutes, should suffice.
@George G
I think the aircraft was in the vicinity for the previous 2 hours.
The incoming line from Perth is misleading and an artefact of the system not being fed the previous point.
We will see when I run the previous 10 minutes, what else we want to look at. Before I ran this 10 minute snapshot, @Rob and I had only run spot checks at various times and locations.
@David, @George G,
The track of the AMSA Challenger jet shows it was circling in the vicinity of the stricken Indonesian vessel. Here is the GDTAAA output from 07:30 UTC to 07:42 UTC. I have included new version of the output at 07:40 UTC and 07:42 UTC with the track history.
https://www.dropbox.com/s/ybumgeb6stu4syd/GDTAAA%20AMSA%20IN%2014MAY2021%200730.png?dl=0
https://www.dropbox.com/s/sgz25b78hiivdu8/GDTAAA%20AMSA%20IN%2014MAY2021%200732.png?dl=0
https://www.dropbox.com/s/d1khbk96phss2f8/GDTAAA%20AMSA%20IN%2014MAY2021%200734.png?dl=0
https://www.dropbox.com/s/jyksf1vs6kddbfo/GDTAAA%20AMSA%20IN%2014MAY2021%200736.png?dl=0
https://www.dropbox.com/s/pxs2vgcmgd9sbfz/GDTAAA%20AMSA%20IN%2014MAY2021%200738.png?dl=0
https://www.dropbox.com/s/m65n6r4nybykg8c/GDTAAA%20AMSA%20IN%2014MAY2021%200740%20V2.png?dl=0
https://www.dropbox.com/s/6opjw0f8pgrfygt/GDTAAA%20AMSA%20IN%2014MAY2021%200742%20V2.png?dl=0
@Richard. Thank you. I was pondering whether the track was of another aircraft. Cobham have 4 Challengers apparently, operating from three bases, so unlikely to be 2 in Perth. Leaving the RAAF.
However that clears it up. I note the 0740 spot has shifted south a little:
https://www.dropbox.com/s/qt87fvy347yh4bd/Comparison%20of%20orig%20and%20revised%200740%20Challenger%20positions.jpg?dl=0
More evident here:https://www.dropbox.com/s/1ko3kn6z4cptlzm/Comparison%20of%20original%20and%20revised%200742%20Challenger%20positions.jpg?dl=0
Remaining a bit of a nark is that ground speed upwind is higher than down but I take it that the accuracy of both is somewhat plus and minus.
I await George G’s comments with interest and of course your MH371 outcome.
@Richard,
Congratulations.
You have overcome a big hurdle.
And you have provided what I would consider a valid demonstration.
And,
I presume,
You will have made another improvement to your process and system.
@Richard, @David,
Without checking for details, my memory, Richard, is that your estimate for positional accuracy is/was in the order of 18 Nm. You may now be in the throes of throwing back and forth whether a more “precise” estimate may be applicable given some conditions yet to be determined.
(i.e. given the right circumstances)
In the circumstance, let’s compare your estimates of position at two different times:
At 0742 UTC (1542Perth) you have the aircraft going west at 200 knots GS,
and at Position 31.250S 101.900E.
At 0746 UTC (1546Perth) you have the aircraft going east at 213 knots GS,
and at Position 31.310S 101.920E.
I leave it for someone else (David ?) to estimate the distance between these two tracks.
With respect to the wind at the time, if the aircraft was traveling both legs of its passes at the same airspeed, then we can estimate the wind as 6.5 knots from the west. (quite gentle really). Based upon the data given in the GDTAAA plots.
Actual conditions may have been different, but “from here” I really see no reason why. …. David ?
Again, from memory without checking for details, my recollection is that you are estimating speed from past flight details or GTDAAA positional estimates.
@David,
You wrote: ” I note the 0740 spot has shifted south a little”
The “0740 spot” is positionally determined by the assumed track from “past performance” (sorry, that term from financial institutions just got stuck in my head) and the “Progress Indicator” in the path of the assumed track.
So, if the “past performance” of the aircraft gets revised based upon updated previous track information, then the crossing point may also be updated.
Quite a valid point.
@David, @George,
You are correct that the 07:40 UTC position has been slightly revised.
There was no previous position data in the system when I first presented the GDTAAA output at 07:40 UTC other than the aircraft was based in Perth (AMSA has four Challenger jet aircraft, but only one based in Perth).
The position accuracy of the order of 18 nm is largely due to the use of the 6 character Maidenhead Grid for both the Tx and Rx stations (not GPS latitude and longitude co-ordinates) and the great circle path modelling based on a WGS84 datum surface using an oblate spheroid model of the earth’s surface. Any possible future commercial usage of GDTAAA would require the exact GPS co-ordinates from all participating WSPR stations. GPS is also based on WGS84.
The ground speed and track are subordinate calculations based on a series of inherently inaccurate position and progress indicators. I am only able at best to give average ground speed and track over a longer time period. This is not bad for a straight and level flight. This is not very accurate when an aircraft is circling.
My explanation of the higher ground speed into wind is that this is necessary to ensure that the jet aircraft maintains manoeuvrability in the buffeting by the wind and at all costs maintains a significant margin to the stall speed.
There is another consideration and that is there is a wind gradient (or wind shear). Winds are affected at low altitude by friction with the earth’s or ocean’s surface. Pilots handle sudden wind changes by the use of thrust, but there is a time delay in a jet engine reaching the thrust level demanded by the pilot. A pilot has to anticipate wind changes and ensure safety margins. Perhaps @Andrew or other pilots could comment on how they would expect the AMSA Challenger pilot to be handling the strong winds whilst circling above the ocean at 500 feet.
When landing a single engined aircraft or glider it was always into the wind and I was always aware of the wind gradient causing a change in apparent wind speed close to the ground. You always had one hand on the throttle lever in a single engined aircraft. In a glider it was different (of course, there is no engine) but the lift near the ground on a hot day when you pass over a wooded area or even over a tarmac area was significant, so you had one hand on the spoilers lever if you suddenly had too much lift. Similarly passing over a ridge on the descent toward the landing strip on a windy day would sometimes offer a surprise.
@George G. I see the speed anomalies may be subsumed within my ‘plus and minus’ tolerance possibility.
Indeed Richard says, “I am only able at best to give average ground speed and track over a longer time period. This is not bad for a straight and level flight.”
The tolerances do need to be wide though.
From the white cap appearance I put its wind strength at the time of the GDTAAA assessment as lower than the GDAS 30 knots that Richard quotes, presumably that being at 10ft above nominal sea level. But in any case the aircraft was climbing past 300 ft and the wind most likely would be different there anyway. Assuming 30 knots though and the GDAS direction from 060˚, during reciprocal 090˚ and 270˚ courses the ground speed at constant IAS would be respectively slowed by 26 knots then boosted by the same, a nominal difference of 52 knots.
The question is whether 13 knots difference in the reverse direction is beyond reasonable tolerance.
On that, an example of the extent of GDTAAA tolerances that may apply currently is in the apparent differences of turn diameter at the two racetrack ends. By my screen measure that starting at 0738, at the eastern end, is a touch over 4 miles. That is about 22% greater than that following at the western end, starting 0744.
@Richard. Possible editorial. You might need to adjust the course from 0740 to 0742 from its labelled 270˚, to adjust for the changed 0740 position – to about 278˚ I think, also by my screen measure.
More substantially, I now have gained from the “07:45:57” video, which as you know actually starts at 07:45:53, at 0746 the TGT LOS bearing and distance can be discerned as 049˚, O.5 NM. Its track (or possibly heading) is 044˚ and stays within a degree of steady.
Comparing this with the GDTAAA position then you will see that the two do not match, the courses in particular:
https://www.dropbox.com/s/ouej9mxhow2fbe4/Comparison%20of%20video%20position%20and%20course%20at%200746%20with%20those%20of%20GDTAAA.jpg?dl=0
@Andrew. From Richard’s 16:23, you said, “There might have been some turbulence associated with the wind, as you described, but I doubt that it would have been significant over the ocean.”
My recollection of being in a coastal surface search in a Dakota (C 47), initially in a gale (the sea white all over with breakers and spray), flying at a two or three hundred feet, you say you, “doubt that it would have been significant over the ocean.” As you expect, the turbulence was not severe though it might have been more abrupt at the Challenger speed.
It now appears more likely that there was a turn towards the vessel at O740. Possibly my above indicates another turn towards at 0746. Perhaps he would have chosen a figure eight vice racetrack, to get closer.
@David,
At first, I must say that I think it is remarkable to have been able to discern any aircraft position and flight information from what Richard has attempted and what he has presented.
But, earlier (this morning) I penned (well typed):
Firstly, it seems “unreal” that from a source set of locations with what Richard estimates to have an uncertainty of 18 Nm that it is possible to determine locations as consistent as those he (with the help of GDTAAA) has been able to derive in the case of the Challenger.
Then: Secondly: The second case is trivial. We know that speed estimations are “notoriously” erratic given a few scattered data points spaced close together, as in the case of the Challenger analysis so far conducted.
I have been considering that some form of reality checks will be necessary, and intend to (attempt to) put some together. Due to other activities or commitments this may take a few days (or not).
You have made reference to 0746 UTC.
Refer to the single Frame, or shot, RSCU550 D2S2 POB wide.PNG.
This shows the camera looking at the persons on board the vessel from LOS distance as you discerned of 0.5 NM, at a bearing of 049˚, as also indicated by the compass pointer at the upper left of the screen.
The aircraft heading, or track (?), being 045˚, and being consistent with the video where the aircraft is about to pass over the vessel in a climb.
(As almost an aside, and purely speculation, I have wondered if this was a farewell pass before flying out of the immediate vicinity, so that the Hercules could arrive and drop more life rafts.)
Your Comparison … .jpg makes the necessary comparison.
@Richard,
I know your concern is MH370 in 2014, and MH371 will/may be of assistance in confirming confidence or otherwise in the Asian portion of the final MH370 flight, but it may be appropriate to utilise the aircraft flights made on 14May2021 by all three (or four ?) aircraft to the vessel in distress in order to refine and gain confidence in GDTAAA and the error bounds.
NOTE: If it becomes appropriate, when such confidence in error bounds IS obtained, THEN it may be really worthwhile to obtain more precise details of the locations of those WSPR TX/RX which may be involved in detailing the flightpath of 9M-MRO on MH370.
I have just seen that the first paragraph in my:
George G on 22 May 2021 at 15:11 to @David
could be misconstrued.
It should read:
At first, I must say that I think it is remarkable that Richard has been able to discern any aircraft position and flight information from what he has attempted and what he has presented.
@David
Thank you for pointing out the discrepancy between the video evidence and the GDTAAA output.
Whether the aircraft was flying a racetrack holding pattern or a figure of eight holding pattern is also a good question.
@George G
I agree with you we need to look at the wider picture for the AMSA Challenger jet and at the other ADF aircraft in the AMSA co-ordinated rescue.
I think it is a worthwhile validation test before publishing either the MH371 validation test report or the initial MH370 flight (take off to 18:00:51 UTC) report.
@All,
I have it on good authority from the Expedition Leader of the DSSV Pressure Drop that they have no plans in regards to MH370.
They have always believed that a cost effective, efficient and successful search would require a broad swath (towed array) side-scan sonar with an experienced team. Hindsight appears to validate that view.
If the wreckage were found below 6000m then we could certainly provide a service that no ROV could provide.
@All,
Another good article from Geoffrey Thomas …
This time on the dismissed MH370 search claims.
https://www.airlineratings.com/news/new-mh370-search-claim-dismissed/
@David, @George G, @Andrew,
The ViDAR screen shots and videos from the AMSA Challenger jet do not give the GS.
@Andrew responded with the following insights and question: “The pilot would need to maintain sufficient airspeed to ensure manoeuvrability and an adequate margin above the stall speed. At a constant airspeed, the groundspeed would obviously change with the wind and, assuming the airspeed was constant, the groundspeed would be higher flying downwind, ie the opposite of what you observed.
There might have been some turbulence associated with the wind, as you described, but I doubt that it would have been significant over the ocean. It was reported that the aircraft dropped several life rafts to the stricken vessel. It might be the case that the aircraft was flying a racetrack pattern for airdrop purposes and was maintaining a constant groundspeed to help calculate the release point for the life rafts. Is the difference in speed that you observed within the margin of error for a constant groundspeed?”
My answer to @Andrew was: “You are probably right that the ground speeds observed are within the margin of error for a constant ground speed.”
I may well be guilty of over analysing this situation.
@All
Geoffrey Thomas has debunked Mike Chillit’s claims in a new article:
https://www.airlineratings.com/news/new-mh370-search-dssv-pressure-drop-debunked/
@David, @George,
The team effort to validate GDTAAA is going through a standard process of forming, storming, norming and performing. We are currently in the storming stage. There will be disagreements, but that is good. For example, the GDTAAA validation test using the flight path of the AMSA Challenger jet whilst circling the Indonesian fishing vessel in distress reveals some of the limitations of the GDTAAA system and process.
The Bombardier Challenger CL-604 special mission jet has a stall speed of 96 knots according to the manufacturer. The GDAS weather data the wind between 06:00 UTC and 09:00 UTC varied between 28 knots and 32 knots from 060°T. Using the AMSA video links provided by @David and noting the change in position during 29 seconds starting at 05:43:50 UTC and during 9 seconds starting at 07:45:53 UTC, the ground speed varies between 149.0 knots and 220.5 knots. Over such short timeframes where the aircraft was obviously not in straight and level flight, the actual ground speed will be different. Assuming (for the sake of argument) that the ground speed was 184.75 knots ± 35.75 knots and assuming the pilot wanted to maintain an air speed of more than the stall speed plus the maximum adverse wind speed plus a safety margin, then the aircraft air speed was greater than 96 knots + 32 knots + safety margin ≥ 128 knots + say 20% ≥ 153.6 knots.
GDTAAA calculates the ground speed and track from a series of position and progress indicators. A single progress indicator based on a great circle path between a Tx station and a Rx station locations defined by a 6 character Maidenhead Grid reference has an accuracy of around ± 5.3 km. This depends on the latitude and longitude of both stations, where the stations are located within the Maidenhead Grid cell and whether the short or long path great circle is used.
The Maidenhead Grid Code uses the 18 letters A to R for the first Lat/Lon pair giving a cell 20° of longitude by 10° of latitude. The second Lat/Lon pair use the 10 numbers 0 to 9 giving a cell 2° of longitude by 1° of latitude. The third Lat/Lon pair use the 24 letters a to x giving a cell 5’ of longitude and 2.5’ of latitude. An example Maidenhead Grid reference for a WSPR station is EM18bc. An example WSPR TxRx link is EM18bcIL38bo.
For example a Tx station at FF00aa is at a Latitude of 39.979167°S ± 0.0208333° and a Longitude of 79.958333°W ± 0.041667°. Here is a chart for a hypothetical WSPR TxRx Link between FF00aa and LL00aa:
https://www.dropbox.com/s/oliskjzj17na1ci/GDTAAA%20WSPR%20TxRx%20Link%20Test.png?dl=0
Many radio amateurs use a tool called VOACAP. Here is the same example in VOACAP:
https://www.dropbox.com/s/26no3iknqr58cb7/VOACAP%20WSPR%20TxRx%20Link%20Test.png?dl=0
The AMSA video information at between 149.0 knots and 220.5 knots aligns only very generally with the GDTAAA output at between 200.0 knots and 213.0 knots. The AMSA video information aligns with the GDAS wind data and the expectation to maintain an air speed of at least 153.6 knots.
Since the Bombardier Challenger CL-604 aircraft type has experienced three bad crashes in stall, wind shear and wake turbulence, then it might be that pilots are more sensitive to these issues. The three bad crashes were:
(1) 1980 during a test flight in the Mojave desert the aircraft crashed after the failure of the release mechanism to detach the recovery chute after a deep stall.
(2) 2014 in Aspen, Colorado the aircraft crashed due to pilot error during a tailwind landing in low level wind shear and gust conditions after a go around.
(3) 2017 over Muscat, Oman the aircraft experienced a 9,000 feet altitude loss after passing through the wake turbulence from an Airbus A380. The aircraft was written off due to damage after an emergency landing.
@David, @George G,
Here is the GDTAAA output for the AMSA Challenger leaving Perth for the aerial search in order to locate the Indonesian fishing vessel.
The departure was shortly before 04:00 Perth time and the aircraft is picked up after take off still at a relatively low altitude. It is still night time in Perth and there are an increased number of WSPR links (stable and anomalous). These include both short and long path WSPR links as well as WSPR links involving stations close to the airport and far away. There is a higher percentage of anomalous links (both SNR and drift) and I will rerun the process with the sensitivity turned down. I have already adjusted the “squelch” by removing the large number of stable links. At a cruising speed of 461 knots the AMSA Challenger will arrive in the search area at around 05:40 UTC. Sunrise in the search area on 14th May 2021 was at 05:27 Perth Time (PT).
It is interesting to note that I observe the opposite effect back in 2014. On a cold damp morning of 7th March 2014 01:34 UTC (09:34 Local Time) as MH371 is departing from Beijing there are hardly any WSPR links in the initial minutes of the flight.
https://www.dropbox.com/s/5sm2bn9993jhxei/GDTAAA%20MH371%20Flight%20Path%200142%20UTC.png?dl=0
Here are links to the GDTAAA output between 04:00 PT and 04:10 PT. I intend to track the aircraft all the way out to the search area and back to Perth. I have attached the data in an Excel table.
https://www.dropbox.com/s/pq3iogbd2a36kc8/GDTAAA%20AMSA%20IN%2014MAY2021%200400%20PT%20A.png?dl=0
https://www.dropbox.com/s/u3ljfisjse2n0es/GDTAAA%20AMSA%20IN%2014MAY2021%200402%20PT%20A.png?dl=0
https://www.dropbox.com/s/uiw2lpftp67uk6b/GDTAAA%20AMSA%20IN%2014MAY2021%200404%20PT%20A.png?dl=0
https://www.dropbox.com/s/xe4fj0hr14bilvw/GDTAAA%20AMSA%20IN%2014MAY2021%200406%20PT%20A.png?dl=0
https://www.dropbox.com/s/whyq7hg6jjzhuyw/GDTAAA%20AMSA%20IN%2014MAY2021%200408%20PT%20A.png?dl=0
https://www.dropbox.com/s/tp4qcvumnda76ps/GDTAAA%20AMSA%20IN%2014MAY2021%200410%20PT%20A.png?dl=0
https://www.dropbox.com/s/ap6wlcwml0qr8t2/wsprspots-2021-05-13-2000-2010%20UTC%20Anomalous.xlsx?dl=0
@David, @George G,
Here is the flight path for the first hour after the AMSA Challenger jet left Perth for the aerial search in order to locate the Indonesian fishing vessel.
It appears that there may have been two AMSA Challenger jets and another one was flown in from another AMSA base to help, but I have focused on the first jet at the moment.
I have measured the average ground speed from the first position indicator. I have also assumed that the aircraft was flying a great circle path and the track is given with both an initial bearing (IB) and a final bearing (FB).
In addition to the 2 minute GDTAAA output in my previous comment, I attach the 10 minute GDTAAA output for the first hour (I have updated the chart at 04:10 PT):
https://www.dropbox.com/s/mittzpgvumfzee5/GDTAAA%20AMSA%20IN%2014MAY2021%200410%20PT%20A%20V2.png?dl=0
https://www.dropbox.com/s/nrbqee4n4534cq3/GDTAAA%20AMSA%20IN%2014MAY2021%200420%20PT%20A.png?dl=0
https://www.dropbox.com/s/5ds4wtbzfu87xr4/GDTAAA%20AMSA%20IN%2014MAY2021%200430%20PT%20A.png?dl=0
https://www.dropbox.com/s/uh6de92gdyaw24b/GDTAAA%20AMSA%20IN%2014MAY2021%200440%20PT%20A.png?dl=0
https://www.dropbox.com/s/5u73davof8lm8f6/GDTAAA%20AMSA%20IN%2014MAY2021%200450%20PT%20A.png?dl=0
https://www.dropbox.com/s/1e3vm04ktkekj0w/GDTAAA%20AMSA%20IN%2014MAY2021%200500%20PT%20A.png?dl=0
The WSPR anomalous link data is in the attached Excel table (42,484 rows and 6.6 MB):
https://www.dropbox.com/s/81t896e5itzrsz1/wsprspots-2021-05-13-2000-2100%20Anomalous.xlsx?dl=0
I plan to cover the arrival in the search area and initial contact with the Indonesian fishing vessel next.
@All
Here is a test of the GDTAAA output using the flight path of an AMSA Challenger jet sent to help rescue the Indonesian fishermen after their boat started to sink in heavy weather. The aircraft departed from Perth Airport at around 03:53 Perth Time (PT).
The chart shows the flight path detected using WSPR anomalies.
The chart compares the flight path to a Rhumb Line or Loxodrome at constant Ground Speed (marked in a red line). The AMSA Challenger jet would be expected to follow a Great Circle or Orthodrome at a Mach speed schedule. You can see the aircraft follows a Great Circle (marked in a grey line) fairly closely and the average Ground Speed from the start of the cruise at around 04:10 PT is speeding up as expected. In the climb between 03:53 PT and 04:10 PT the GDTAAA output is a little wobbly, but once established in the cruise the GDTAAA output at each of the light grey markers is quite close to the great circle line also marked in light grey.
https://www.dropbox.com/s/9guy4bfqpare8b1/Loxodrome%20Test.png?dl=0
@Richard,
Sorry, I should have woken up to this before, and as there will be more time before Midnight UTC: Your chart headings read 13th March 2021 TimeUTC -14th May PerthTime.
When the flight path becomes more complicated as the aircraft reaches the search area, it may be possible to still use time spacings larger than the minimum of two minutes, until they descend, I wonder.
@George G,
I plan on using 10 minutes spacing until I get to the search area and then use 2 minutes spacing so we can see what pattern the aircraft flew.
@All,
I have had a private email from Donato Bonavoglia (callsign IW8ZLB), a university student in Italy, who is an active member of the WSPR community. His professor has accepted the topic of WSPR and aircraft detection for a degree thesis.
We have offered our help, where we can.
Donato has offered that I may publish his research and his paper on this web site.
Eccellente. Spero che Donato partecipi a questo blog.
@Richard. About your 22nd at 19:36, the ground speed and direction, being the vector sum of airspeed plus wind, will of course vary with the direction and extent of both. If flying repetitive patterns I would think his major compensation would be in heading – against cross wind – so that his holding pattern does not drift across the vessel’s position and his approaches to it are straight..
As to upwind and downwind wind effects, since stall and safety margin would be IAS dependent and unrelated to wind therefore, maintenance of ground speed will depend on other requirements.
Looking at the ground speeds and directions realised in the first two videos, I have assessed what those were, while taking care that the aircraft positions over these short intervals match exact seconds as best I can. One unknown to me is whether what could well be headings in the video are in fact tracks, though I find the resulting difference to be small.
In summary, in the earliest video, which starts at 05:43:51 UTC, its ground speed is 222 kts.
If that notional starting ‘296’ ‘course’ is the heading, having averaged the course evident then and later at 289˚I make its airspeed as 201 kts. Its track is 283˚. In this I take the wind to be from 060˚, 30 knots, as per GDAS.
If that 289˚ is instead the track, the heading is 295˚, airspeed 203 kts.
So track or heading does not make a lot of difference.
I am unable to say how accurate these assessments are quantitatively but qualitatively I would say they are a good guide and better than ‘indicative’.
There is of course a downwind component on this leg. Cross wind is from right to left.
In the later video starting at 07:45:53, same wind assumed, I estimate a ground speed of 180 kts , that is while flying close to directly into the wind. The ‘course’ I average as 044˚. If that is the track the heading is 047˚, airspeed 209 knots. If 044˚ is the heading, the airspeed remains at 209 kts, track 041˚.
So in summary these tracks are not reciprocals because the second was heading at the distressed vessel, the first on 289˚ was passing.
The main point seems to be that the air speeds were not much different, 201/203 knots downwind 209 knots up. Within my expected levels of accuracy they might be the same, between the two.
These figures may be of some use to your plot of that flight. I think that flight in particular is worth dwelling on for ‘calibration’ because there is this independent info from the videos.
I have not analysed the later night flight because you have not found that on GDTAAA to my knowledge.
I am trying to get data on RAAF flights, ie the two P-8As and the CJ-130, through the defence media organisation; but naturally with no response as yet.
There is considerable confusion with AMSA as to how many Challenger flights there were, they pointing to their media release (which says one sortie), declining to clarify further and referring me to air trackers, though that of course should help. Perhaps it has?
Which brings me to your 23rd May,12:39, et seq, an earlier flight. I am getting lost here as to whether you have identified this definitely as a Challenger.
If so, presumably that followed a location of the vessel by the RAAF with radar etc.
One source of confusion might be if the AMSA video flight times, shown as UTC are in fact Perth times, though that would not explain how the IR photo, ostensibly on the 14th, was taken in the early afternoon if that was Perth time and earlier by the sun still at 700 odd miles west. So that doesn’t add up.
@George G. Your 22nd May at 15:11. My thanks.
@David,
Many thanks for you detailed analysis of my earlier GDTAAA output in the vicinity of the Indonesian fishing vessel. I agree with you that my assumption in these two 10 minute excerpts that the search aircraft was an AMSA Challenger jet and that it was flying a racetrack holding pattern, go beyond the capability of GDTAAA.
GDTAAA has no aircraft identification capability, just a detection and tracking capability. GDTAAA has little instantaneous ground speed and track capability, just an average ground speed and average track over longer periods of time.
I will continue to track the search aircraft to the search area and will be more careful in my analysis of the flight path every 2 minutes once the search area is reached.
The AMSA media release that you previously linked is clear that the aircraft that filmed and photographed the Indonesian crew and their vessel D2S2 at 14MAY2021 05:43:48 UTC, 14MAY2021 07:45:57 UTC and with Infra Red (IR) at 14MAY 2021 13:47:25 UTC was an AMSA Challenger jet (RSCU550).
I am sure that the times are as stated UTC and not local time either in Perth or the SIO.
I do not believe that it is possible that all these videos and photographs come from the same single sortie which lasted from 05:43:48 UTC to 13:47:25 UTC in the search area. The search area is around 1 hour 45 minutes flying time from Perth. The sortie would have lasted 11.5 hours ([1.75 x 2] transfer time + 8.0 search area time = 11.5 hours), which is beyond the endurance capability of the Bombardier Challenger 604 at 6.9 hours.
There is no information about the two RAAF Poseidon P-8A aircraft and the Hercules C-130J other than they were involved in the search. How many sorties were flown or at what times is not public domain information, as far as I know.
@Rob and I have picked up 8 sorties into the SIO during the 13MAY2021 to 15 MAY2021 timeframe. So far I have only started to detail the flight path of one sortie.
@David,
Some hours ago I was proceeding with “Uncertainties – Chapter 1” which I had intended to post here, and presumably still will at a later time. However some questions you raised re-directed me and since I have been further distracted along a follow-on path.
Your suggestion that the times might not actually be UTC had earlier reared it’s ugly head in my mind for a short time. To resolve our confusion, re-look at the eight-second video “AMSA Challenger Vision – Life rafts and survivors” and again at the corresponding still “RSCU550 D2S2 POB wide” supposedly at 07:46:00 UTC, being 15:46:00 Perth Time AWST. At the rescue site the sensible comparable time would be in the order of (say) 14:40 hours. Look at the shadows. They are consistent with this “sensible” time estimate. It appears that the sun is west of North.
We need no longer have doubts about the time displayed in the camera work being UTC.
Richard,
No, I don’t think the aircraft you are following to the distressed vessel is this Challenger. The AMSA has published write-ups quoting up to 8 hours endurance. There is no hint of it extending to anywhere near like 14 hours, to my limited knowledge.
@George G. “We need no longer have doubts about the time displayed in the camera work being UTC.”
No, agree.
@Richard, thank you.